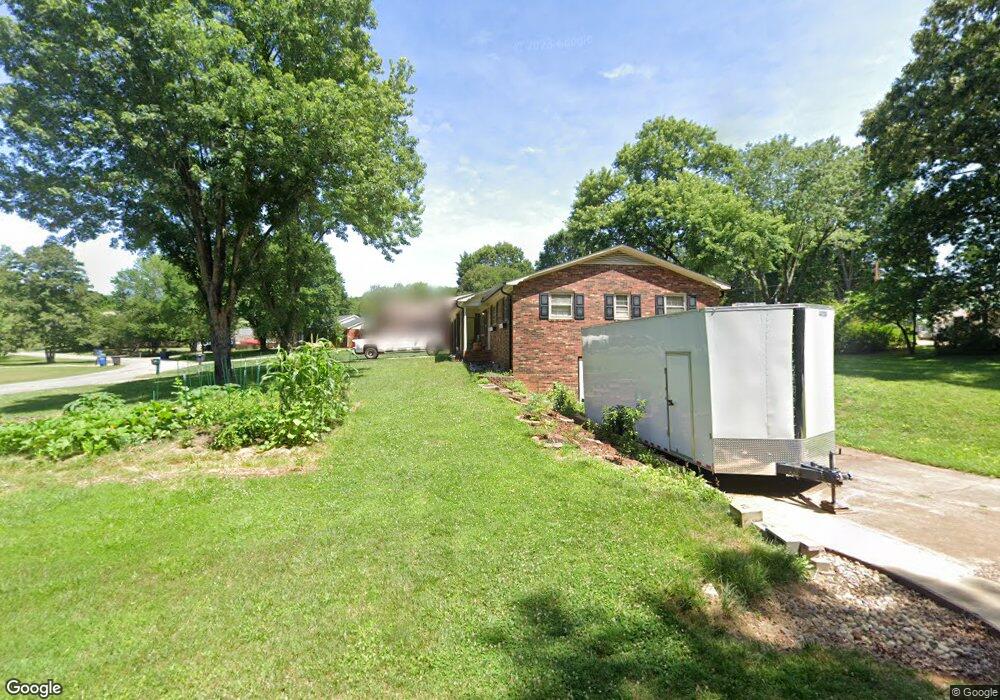
417 Camelot Dr Statesville, NC 28625
Estimated Value: $274,991 - $323,000
3
Beds
2
Baths
1,982
Sq Ft
$152/Sq Ft
Est. Value
About This Home
This home is located at 417 Camelot Dr, Statesville, NC 28625 and is currently estimated at $301,748, approximately $152 per square foot. 417 Camelot Dr is a home located in Iredell County with nearby schools including East Iredell Elementary School, East Iredell Middle School, and Statesville High School.
Ownership History
Date
Name
Owned For
Owner Type
Purchase Details
Closed on
Feb 15, 2011
Sold by
Stegemann Elaine
Bought by
Brown Timothy Rixon and Brown Sharon Kelley
Current Estimated Value
Home Financials for this Owner
Home Financials are based on the most recent Mortgage that was taken out on this home.
Original Mortgage
$97,500
Outstanding Balance
$66,654
Interest Rate
4.76%
Mortgage Type
New Conventional
Estimated Equity
$235,094
Purchase Details
Closed on
Jun 22, 1999
Sold by
Vite Jerry C and Vite Christine L
Bought by
Brown Daniel P and Brown Elaine S
Home Financials for this Owner
Home Financials are based on the most recent Mortgage that was taken out on this home.
Original Mortgage
$100,000
Interest Rate
7.04%
Purchase Details
Closed on
Aug 1, 1989
Purchase Details
Closed on
Jun 1, 1977
Purchase Details
Closed on
Jun 1, 1976
Create a Home Valuation Report for This Property
The Home Valuation Report is an in-depth analysis detailing your home's value as well as a comparison with similar homes in the area
Home Values in the Area
Average Home Value in this Area
Purchase History
| Date | Buyer | Sale Price | Title Company |
|---|---|---|---|
| Brown Timothy Rixon | $130,000 | None Available | |
| Brown Daniel P | $126,000 | -- | |
| -- | $84,500 | -- | |
| -- | $50,000 | -- | |
| -- | $3,500 | -- |
Source: Public Records
Mortgage History
| Date | Status | Borrower | Loan Amount |
|---|---|---|---|
| Open | Brown Timothy Rixon | $97,500 | |
| Previous Owner | Brown Daniel P | $100,000 |
Source: Public Records
Tax History Compared to Growth
Tax History
| Year | Tax Paid | Tax Assessment Tax Assessment Total Assessment is a certain percentage of the fair market value that is determined by local assessors to be the total taxable value of land and additions on the property. | Land | Improvement |
|---|---|---|---|---|
| 2024 | $1,972 | $187,850 | $30,000 | $157,850 |
| 2023 | $1,972 | $187,850 | $30,000 | $157,850 |
| 2022 | $1,630 | $139,110 | $15,000 | $124,110 |
| 2021 | $1,686 | $139,110 | $15,000 | $124,110 |
| 2020 | $1,686 | $139,110 | $15,000 | $124,110 |
| 2019 | $1,672 | $139,110 | $15,000 | $124,110 |
| 2018 | $1,407 | $122,440 | $15,000 | $107,440 |
| 2017 | $1,381 | $122,440 | $15,000 | $107,440 |
| 2016 | $1,381 | $122,440 | $15,000 | $107,440 |
| 2015 | $1,200 | $122,440 | $15,000 | $107,440 |
| 2014 | $1,121 | $119,390 | $15,000 | $104,390 |
Source: Public Records
Map
Nearby Homes
- 106 Brookmeade Dr
- 219 E Glen Eagles Rd
- 139 Trillium Dr
- 251 Gleneagles Rd E
- 234 Edgewood Dr
- 3010 Eastway Dr
- 324 Gaston Ct
- 220 Augusta Dr
- 415 N Greenbriar Rd
- 199 Bell Farm Rd
- 152 Sparrow Ln
- 122 Sherlock Dr
- 629 Saint Andrews Rd
- 2756 Peachtree Rd
- 206 White Apple Way
- 517 Augusta Dr
- 2752 Peachtree Rd
- 625 Saint Andrews Rd
- 627 Saint Andrews Rd
- 104 Trissy Ct
- 411 Camelot Dr
- 3405 Somerset Place
- 404 Camelot Dr
- 409 Camelot Dr
- 3404 Somerset Place
- 490 Mocksville Hwy
- 502 Camelot Dr
- 486 Mocksville Hwy
- 507 Camelot Dr
- 405 Camelot Dr
- 504 Mocksville Hwy
- 480 Mocksville Hwy
- 3332 Winchester Ln
- 504 Camelot Dr
- 400 Camelot Dr
- 509 Camelot Dr
- 3328 Winchester Ln
- 474 Mocksville Hwy
- 401 Camelot Dr
- 510 Mocksville Hwy