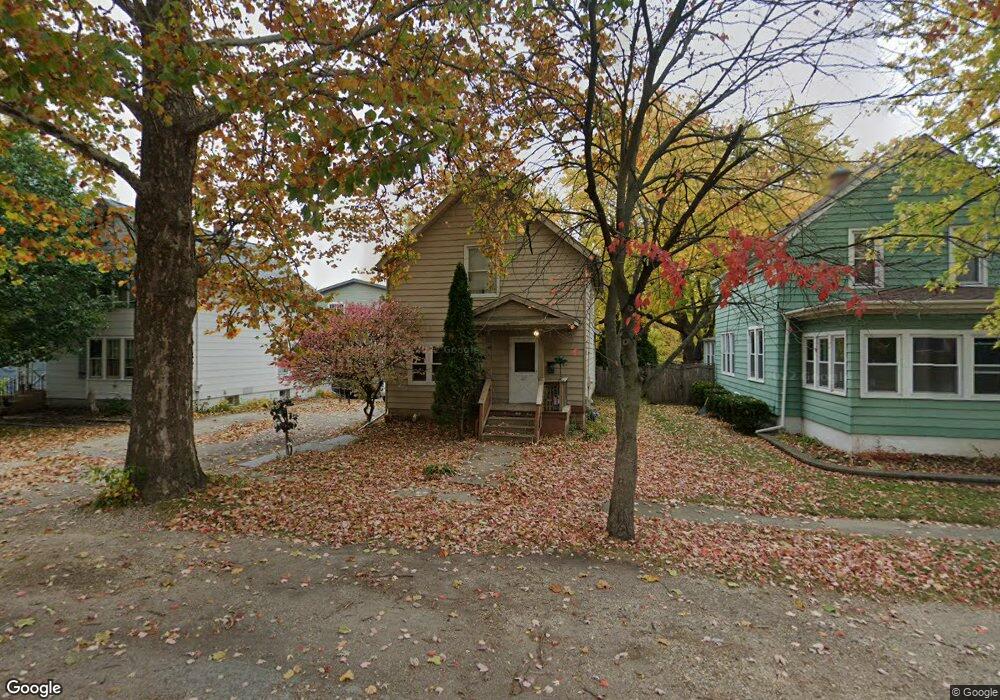
417 Center St Woodstock, IL 60098
Estimated Value: $209,000 - $246,000
3
Beds
2
Baths
1,355
Sq Ft
$170/Sq Ft
Est. Value
About This Home
This home is located at 417 Center St, Woodstock, IL 60098 and is currently estimated at $230,340, approximately $169 per square foot. 417 Center St is a home located in McHenry County with nearby schools including Olson Elementary School, Creekside Middle School, and Woodstock High School.
Ownership History
Date
Name
Owned For
Owner Type
Purchase Details
Closed on
Nov 23, 2022
Sold by
Mlp Llc
Bought by
Siearra Investments Llc
Current Estimated Value
Purchase Details
Closed on
Oct 9, 2015
Sold by
Ortiz
Bought by
Mlp Llc
Purchase Details
Closed on
Jul 27, 1998
Sold by
Mcnicholas Brian and Mcnicholas Suzanne
Bought by
Ortiz Florencio and Ortiz Gabriel
Home Financials for this Owner
Home Financials are based on the most recent Mortgage that was taken out on this home.
Original Mortgage
$111,043
Interest Rate
7.05%
Mortgage Type
FHA
Purchase Details
Closed on
May 30, 1995
Sold by
Hanson Jamie F and Reeb Jamie F
Bought by
Mcniholas Brian and Mcnicholas Susanne
Home Financials for this Owner
Home Financials are based on the most recent Mortgage that was taken out on this home.
Original Mortgage
$95,092
Interest Rate
8.26%
Mortgage Type
FHA
Create a Home Valuation Report for This Property
The Home Valuation Report is an in-depth analysis detailing your home's value as well as a comparison with similar homes in the area
Home Values in the Area
Average Home Value in this Area
Purchase History
| Date | Buyer | Sale Price | Title Company |
|---|---|---|---|
| Siearra Investments Llc | -- | -- | |
| Mlp Llc | $32,000 | Attorney | |
| Ortiz Florencio | $112,000 | -- | |
| Mcniholas Brian | $102,500 | Universal Title Services Inc |
Source: Public Records
Mortgage History
| Date | Status | Borrower | Loan Amount |
|---|---|---|---|
| Previous Owner | Ortiz Florencio | $111,043 | |
| Previous Owner | Mcniholas Brian | $95,092 |
Source: Public Records
Tax History Compared to Growth
Tax History
| Year | Tax Paid | Tax Assessment Tax Assessment Total Assessment is a certain percentage of the fair market value that is determined by local assessors to be the total taxable value of land and additions on the property. | Land | Improvement |
|---|---|---|---|---|
| 2024 | $4,648 | $50,448 | $4,814 | $45,634 |
| 2023 | $4,463 | $45,621 | $4,353 | $41,268 |
| 2022 | $3,552 | $34,455 | $3,863 | $30,592 |
| 2021 | $3,397 | $32,192 | $3,609 | $28,583 |
| 2020 | $3,287 | $30,589 | $3,429 | $27,160 |
| 2019 | $3,203 | $29,199 | $3,273 | $25,926 |
| 2018 | $2,938 | $26,358 | $3,734 | $22,624 |
| 2017 | $2,901 | $24,807 | $3,514 | $21,293 |
| 2016 | $2,899 | $22,970 | $3,254 | $19,716 |
| 2013 | -- | $45,523 | $9,438 | $36,085 |
Source: Public Records
Map
Nearby Homes
- 338 Mchenry Ave
- 0 N Seminary Ave Unit MRD11676693
- 266 Hutchins Ct
- 324 N Madison St
- 200 E Judd St
- 130 Washington St
- 00 Illinois 120
- 724 Wheeler St
- 9999 E Calhoun St
- 82 N Eastwood Dr
- 709 Mchenry Ave
- Lt 7 Flagg Ln
- Lt 8 Flagg Ln
- Lt 13 Flagg Ln
- Lots 8 & 9 Greenwood Cir
- 1288 Prairie Ridge Trail
- 3848 Riverwoods Dr
- 3902 Riverwoods Dr
- 3842 Riverwoods Dr
- 3839 Riverwoods Dr
- 421 Center St
- 411 Center St
- 427 Center St
- 401 Center St
- 429 Center St
- 520 N Eastwood Dr
- 326 Mchenry Ave
- 424 Center St
- 435 Center St
- 524 N Eastwood Dr
- 410 Center St
- 316 Mchenry Ave
- 416 Center St
- 310 Mchenry Ave
- 404 Center St
- 334 Mchenry Ave
- 441 Center St
- Rt 47 Rt 47 Hwy
- S. Route 47 Hwy
- Lot 2 Illinois 47