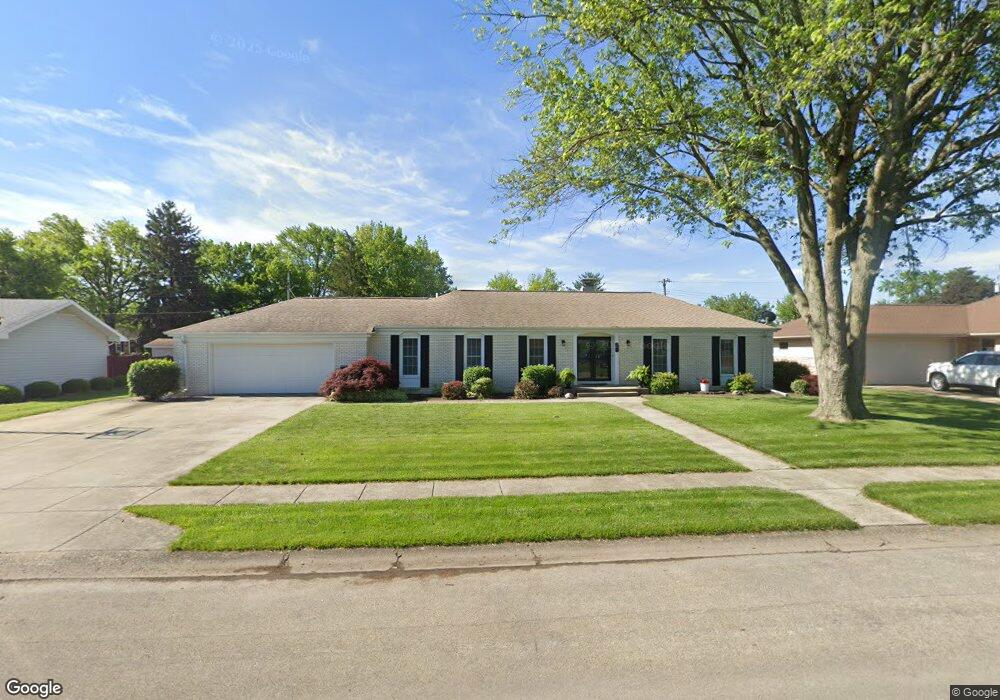
417 Crestmore Ave Mattoon, IL 61938
Estimated Value: $242,661 - $295,000
4
Beds
2
Baths
1,700
Sq Ft
$161/Sq Ft
Est. Value
About This Home
This home is located at 417 Crestmore Ave, Mattoon, IL 61938 and is currently estimated at $273,165, approximately $160 per square foot. 417 Crestmore Ave is a home located in Coles County with nearby schools including Mattoon High School, St. John's Lutheran School, and St Mary School.
Ownership History
Date
Name
Owned For
Owner Type
Purchase Details
Closed on
Oct 23, 2020
Sold by
Beason George P and Beason Mary E
Bought by
Stoltzfus Dustin S and Stoltzfus Heather N
Current Estimated Value
Home Financials for this Owner
Home Financials are based on the most recent Mortgage that was taken out on this home.
Original Mortgage
$190,000
Outstanding Balance
$170,780
Interest Rate
3.5%
Mortgage Type
New Conventional
Estimated Equity
$102,385
Purchase Details
Closed on
Sep 10, 2005
Sold by
Illinois Great Rivers Annual Conference
Bought by
Beason George P and Beason Mary E
Home Financials for this Owner
Home Financials are based on the most recent Mortgage that was taken out on this home.
Original Mortgage
$81,000
Interest Rate
5.93%
Mortgage Type
Credit Line Revolving
Create a Home Valuation Report for This Property
The Home Valuation Report is an in-depth analysis detailing your home's value as well as a comparison with similar homes in the area
Home Values in the Area
Average Home Value in this Area
Purchase History
| Date | Buyer | Sale Price | Title Company |
|---|---|---|---|
| Stoltzfus Dustin S | $200,000 | None Available | |
| Beason George P | -- | None Available |
Source: Public Records
Mortgage History
| Date | Status | Borrower | Loan Amount |
|---|---|---|---|
| Open | Stoltzfus Dustin S | $190,000 | |
| Previous Owner | Beason George P | $81,000 |
Source: Public Records
Tax History
| Year | Tax Paid | Tax Assessment Tax Assessment Total Assessment is a certain percentage of the fair market value that is determined by local assessors to be the total taxable value of land and additions on the property. | Land | Improvement |
|---|---|---|---|---|
| 2024 | $6,500 | $75,383 | $9,451 | $65,932 |
| 2023 | $5,895 | $67,912 | $8,514 | $59,398 |
| 2022 | $5,895 | $66,790 | $8,373 | $58,417 |
| 2021 | $5,790 | $60,171 | $7,543 | $52,628 |
| 2020 | $5,177 | $62,343 | $8,117 | $54,226 |
| 2019 | $5,072 | $60,171 | $7,834 | $52,337 |
| 2018 | $4,980 | $60,171 | $7,834 | $52,337 |
| 2017 | $4,501 | $55,047 | $7,834 | $47,213 |
| 2016 | $4,399 | $55,047 | $7,834 | $47,213 |
| 2015 | $4,271 | $53,967 | $7,680 | $46,287 |
| 2014 | $4,271 | $53,967 | $7,680 | $46,287 |
| 2013 | $4,271 | $53,967 | $7,680 | $46,287 |
Source: Public Records
Map
Nearby Homes
- 420 Crestview Dr
- 620 Odd Fellow Rd
- 22 Elm Ridge
- 304 Dewitt Ave
- 20 Cambridge
- 21 Cambridge
- 421 Dewitt Ave
- 309 Essex Ave
- 1012 S 6th St
- 705 Marion Ave
- 7 Mitchell Ave
- 23 Cambridge
- LOT 37 Broadmoor Edgewater
- 1001 Wabash Ave
- 812 N 8th St Unit 64
- 812 N 8th St Unit 36
- 1101 Wabash Ave
- 632 Woodlawn Ave
- 0 Lot 8 Augusta Lakes
- 916 Piatt Ave
- 421 Crestmore Ave
- 415 Crestmore Ave
- 408 Crestmore Ave
- 412 Crestmore Ave
- 411 Lafayette Ave E
- 425 Crestmore Ave
- 413 Lafayette Ave E
- 409 Crestmore Ave
- 409 Lafayette Ave E
- 416 Crestmore Ave
- 417 Lafayette Ave E
- 405 Crestview Dr
- 409 Crestview Dr
- 501 Crestmore Ave
- 401 Crestview Dr
- 401 Lafayette Ave E
- 413 Crestview Dr
- 500 Crestmore Ave
- 405 Crestmore Ave
- 412 Crescent Dr
Your Personal Tour Guide
Ask me questions while you tour the home.