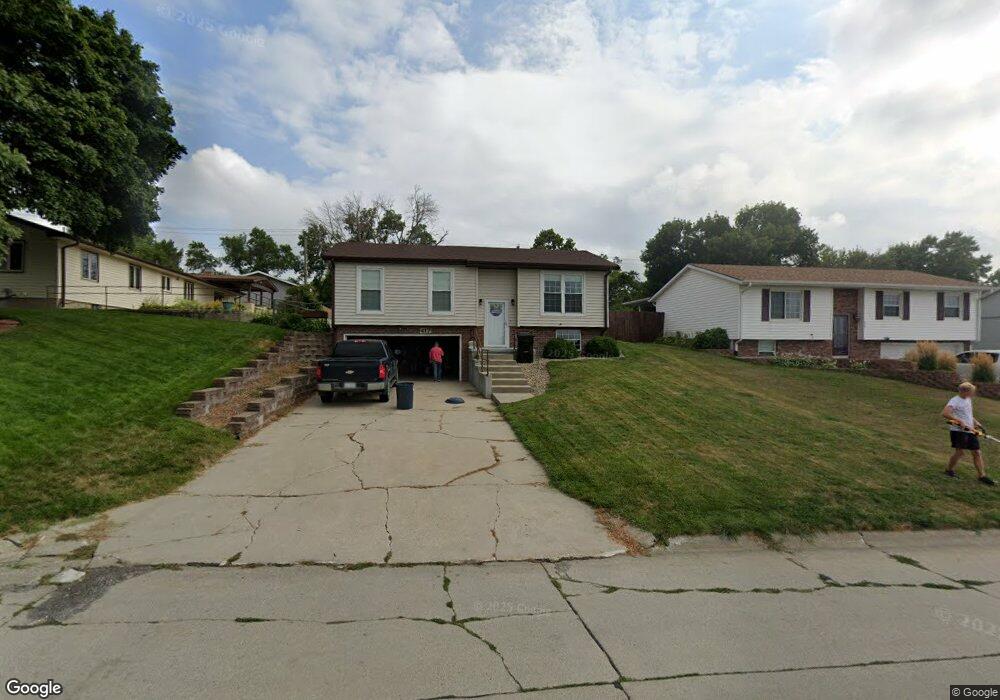
417 E 13th St West Point, NE 68788
Estimated Value: $211,196 - $315,000
3
Beds
2
Baths
998
Sq Ft
$249/Sq Ft
Est. Value
About This Home
This home is located at 417 E 13th St, West Point, NE 68788 and is currently estimated at $248,299, approximately $248 per square foot. 417 E 13th St is a home located in Cuming County with nearby schools including West Point-Beemer Junior/Senior High School, Guardian Angels Elementary School, and St. Paul Lutheran School.
Ownership History
Date
Name
Owned For
Owner Type
Purchase Details
Closed on
Aug 26, 2022
Sold by
Ridder Brandon M and Ridder Jamie L
Bought by
Hoffman Jackson R
Current Estimated Value
Home Financials for this Owner
Home Financials are based on the most recent Mortgage that was taken out on this home.
Original Mortgage
$159,200
Outstanding Balance
$151,841
Interest Rate
5.55%
Estimated Equity
$96,458
Purchase Details
Closed on
Feb 24, 2017
Sold by
Ridder Zachary J and Ridder Wendy J
Bought by
Ridder Brandon M and Ridder Jamie L
Purchase Details
Closed on
Aug 13, 2010
Sold by
Miller Rodney L
Bought by
Miller Willis M and Miller Rodney L
Purchase Details
Closed on
Sep 29, 2008
Sold by
Meyer Restoration Llc
Bought by
Ridder Zachary J
Create a Home Valuation Report for This Property
The Home Valuation Report is an in-depth analysis detailing your home's value as well as a comparison with similar homes in the area
Home Values in the Area
Average Home Value in this Area
Purchase History
| Date | Buyer | Sale Price | Title Company |
|---|---|---|---|
| Hoffman Jackson R | $199,000 | Bracht Law Office | |
| Ridder Brandon M | $117,000 | None Available | |
| Miller Willis M | -- | -- | |
| Ridder Zachary J | $78,000 | -- |
Source: Public Records
Mortgage History
| Date | Status | Borrower | Loan Amount |
|---|---|---|---|
| Open | Hoffman Jackson R | $159,200 | |
| Closed | Ridder Zachary J | $0 |
Source: Public Records
Tax History
| Year | Tax Paid | Tax Assessment Tax Assessment Total Assessment is a certain percentage of the fair market value that is determined by local assessors to be the total taxable value of land and additions on the property. | Land | Improvement |
|---|---|---|---|---|
| 2025 | $1,248 | $164,575 | $15,375 | $149,200 |
| 2024 | $1,308 | $153,455 | $15,375 | $138,080 |
| 2023 | $1,644 | $142,445 | $13,585 | $128,860 |
| 2022 | $1,634 | $129,200 | $13,585 | $115,615 |
| 2021 | $1,532 | $115,030 | $12,515 | $102,515 |
| 2020 | $1,456 | $109,000 | $12,515 | $96,485 |
| 2019 | $1,421 | $103,980 | $12,515 | $91,465 |
| 2018 | $1,320 | $96,185 | $12,515 | $83,670 |
| 2017 | $1,349 | $96,185 | $12,515 | $83,670 |
| 2016 | $1,315 | $91,035 | $11,085 | $79,950 |
| 2015 | $1,399 | $91,035 | $11,085 | $79,950 |
| 2014 | $1,468 | $83,725 | $11,085 | $72,640 |
| 2013 | $1,468 | $83,725 | $11,085 | $72,640 |
Source: Public Records
Map
Nearby Homes
- 1301 N Mill St
- 208 N Lincoln St
- 1402 E Bridge St
- 101 S Main St
- 925 E Grove St
- 126 E Grove St
- 1045 E Grove St
- 420 S Farragut St
- 326 S Maple St
- 205 E Sheridan St
- 1559 S Lincoln St
- 409 Frasier St
- 1225 Co Road 1
- TBD Oakland
- 237 A Rd
- 314 W 2nd St
- 521 N Logan Ave
- 328 N Oakland Ave
- 1045 U S 77
- 206 N Thomas Ave
Your Personal Tour Guide
Ask me questions while you tour the home.