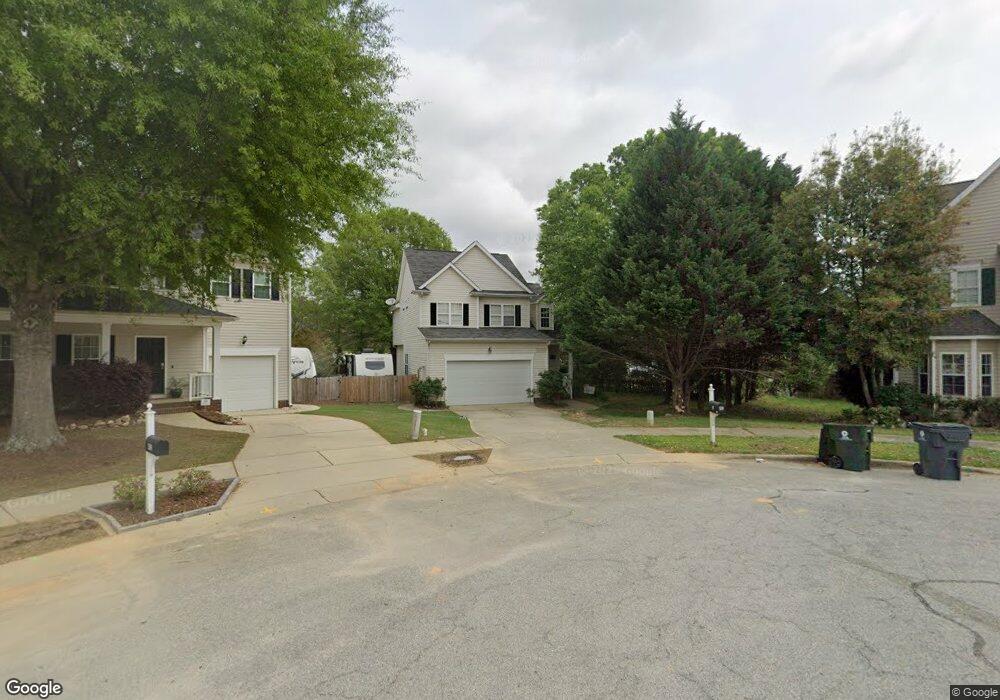
417 E Maple Ave Holly Springs, NC 27540
Estimated Value: $443,000 - $469,000
4
Beds
3
Baths
1,900
Sq Ft
$241/Sq Ft
Est. Value
About This Home
This home is located at 417 E Maple Ave, Holly Springs, NC 27540 and is currently estimated at $457,171, approximately $240 per square foot. 417 E Maple Ave is a home located in Wake County with nearby schools including Holly Ridge Elementary School, Holly Springs High School, and Pine Springs Prep Academy.
Ownership History
Date
Name
Owned For
Owner Type
Purchase Details
Closed on
Oct 15, 2013
Sold by
Cannon Michael J
Bought by
American Homes 4 Rent Properties Nine Ll
Current Estimated Value
Purchase Details
Closed on
Jul 19, 2013
Sold by
Cannon Kelli S
Bought by
Cannon Michael J
Purchase Details
Closed on
May 30, 2002
Sold by
Phelan Building & Development Inc
Bought by
Cannon Michael J and Cannon Kelli S
Home Financials for this Owner
Home Financials are based on the most recent Mortgage that was taken out on this home.
Original Mortgage
$153,900
Interest Rate
6.92%
Mortgage Type
VA
Purchase Details
Closed on
Dec 10, 2001
Sold by
Phelan Curtis D
Bought by
Phelan Building & Development Inc
Home Financials for this Owner
Home Financials are based on the most recent Mortgage that was taken out on this home.
Original Mortgage
$28,500
Interest Rate
6.5%
Create a Home Valuation Report for This Property
The Home Valuation Report is an in-depth analysis detailing your home's value as well as a comparison with similar homes in the area
Home Values in the Area
Average Home Value in this Area
Purchase History
| Date | Buyer | Sale Price | Title Company |
|---|---|---|---|
| American Homes 4 Rent Properties Nine Ll | $170,000 | None Available | |
| Cannon Michael J | -- | None Available | |
| Cannon Michael J | $151,000 | -- | |
| Phelan Building & Development Inc | -- | -- |
Source: Public Records
Mortgage History
| Date | Status | Borrower | Loan Amount |
|---|---|---|---|
| Previous Owner | Cannon Michael J | $153,900 | |
| Previous Owner | Phelan Building & Development Inc | $28,500 |
Source: Public Records
Tax History Compared to Growth
Tax History
| Year | Tax Paid | Tax Assessment Tax Assessment Total Assessment is a certain percentage of the fair market value that is determined by local assessors to be the total taxable value of land and additions on the property. | Land | Improvement |
|---|---|---|---|---|
| 2025 | $4,215 | $487,462 | $120,000 | $367,462 |
| 2024 | $4,198 | $488,869 | $120,000 | $368,869 |
| 2023 | $3,046 | $280,549 | $66,000 | $214,549 |
| 2022 | $2,941 | $280,549 | $66,000 | $214,549 |
| 2021 | $2,886 | $280,549 | $66,000 | $214,549 |
| 2020 | $2,886 | $280,549 | $66,000 | $214,549 |
| 2019 | $2,615 | $215,687 | $44,000 | $171,687 |
| 2018 | $2,364 | $215,687 | $44,000 | $171,687 |
| 2017 | $2,279 | $215,687 | $44,000 | $171,687 |
| 2016 | $2,248 | $215,687 | $44,000 | $171,687 |
| 2015 | $2,064 | $194,799 | $38,500 | $156,299 |
| 2014 | $1,993 | $194,799 | $38,500 | $156,299 |
Source: Public Records
Map
Nearby Homes
- 308 E Maple Ave
- 421 Grigsby Ave
- 717 Utley St
- 220 Avent Ferry Rd
- 401 Vista Springs Cir
- 4014 Kentworth Dr
- 705 Morton Farm Rd
- 225 Seneca Shore Dr
- 2027 Hayes Ln
- 141 Spring Pine Ln
- 109 Lacombe Ct
- 121 Cassada Ct
- 405 W Ballentine St
- 116 Cabrita Ct
- 408 Teal Lake Dr
- 504 Prince Dr
- 104 Chilmark Ridge Dr
- 108 Hidden Farm Ln
- 413 Rhamkatte Rd
- 217 Jones Hill Rd
- 413 E Maple Ave
- 421 E Maple Ave
- 425 E Maple Ave
- 225 Springside Dr
- 221 Springside Dr
- 409 E Maple Ave
- 501 E Maple Ave
- 229 Springside Dr
- 505 E Maple Ave
- 509 E Maple Ave
- 235 Springside Dr
- 220 Springside Dr
- 404 E Maple Ave
- 504 E Maple Ave
- 513 E Maple Ave
- 108 Uphill Ct
- 224 Springside Dr
- 104 Uphill Ct
- 508 E Maple Ave
- 228 Springside Dr