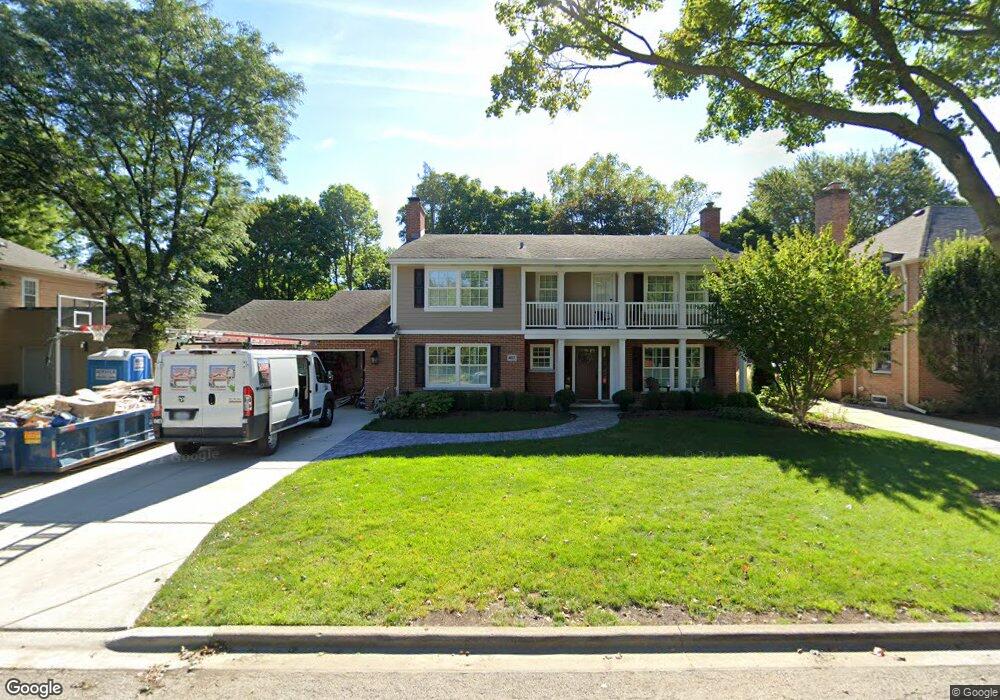
417 E Mayfair Rd Arlington Heights, IL 60005
Estimated Value: $739,403 - $932,000
4
Beds
3
Baths
2,522
Sq Ft
$332/Sq Ft
Est. Value
About This Home
This home is located at 417 E Mayfair Rd, Arlington Heights, IL 60005 and is currently estimated at $837,351, approximately $332 per square foot. 417 E Mayfair Rd is a home located in Cook County with nearby schools including Dryden Elementary School, South Middle School, and Prospect High School.
Ownership History
Date
Name
Owned For
Owner Type
Purchase Details
Closed on
Nov 17, 2020
Sold by
Schmidt Kathleen Anne and Schmidt David Carl
Bought by
Emerald Isle Trust
Current Estimated Value
Home Financials for this Owner
Home Financials are based on the most recent Mortgage that was taken out on this home.
Original Mortgage
$341,658
Interest Rate
2.25%
Mortgage Type
New Conventional
Purchase Details
Closed on
Dec 28, 2012
Sold by
Arganbright M Thomas and Arganbright Carolyn C
Bought by
Emerald Isle Trust and Emerald Isle Ii Trust
Home Financials for this Owner
Home Financials are based on the most recent Mortgage that was taken out on this home.
Original Mortgage
$50,949
Interest Rate
3.3%
Mortgage Type
Credit Line Revolving
Purchase Details
Closed on
Apr 24, 1996
Sold by
Arganbright M Thomas and Arganbright Carolyn C
Bought by
Arganbright Carolyn C
Create a Home Valuation Report for This Property
The Home Valuation Report is an in-depth analysis detailing your home's value as well as a comparison with similar homes in the area
Purchase History
| Date | Buyer | Sale Price | Title Company |
|---|---|---|---|
| Emerald Isle Trust | -- | Westcor Land Title Ins Co | |
| Schmidt David Carl | -- | Westcor Land Title Ins Co | |
| Emerald Isle Trust | $510,000 | Baird & Warner Title Service | |
| Arganbright Carolyn C | -- | -- | |
| Arganbright M Thomas | -- | -- |
Source: Public Records
Mortgage History
| Date | Status | Borrower | Loan Amount |
|---|---|---|---|
| Previous Owner | Schmidt David Carl | $341,658 | |
| Previous Owner | Emerald Isle Trust | $50,949 | |
| Previous Owner | Emerald Isle Trust | $408,000 |
Source: Public Records
Tax History
| Year | Tax Paid | Tax Assessment Tax Assessment Total Assessment is a certain percentage of the fair market value that is determined by local assessors to be the total taxable value of land and additions on the property. | Land | Improvement |
|---|---|---|---|---|
| 2025 | $12,326 | $74,000 | $14,976 | $59,024 |
| 2024 | $12,326 | $48,339 | $14,040 | $34,299 |
| 2023 | $11,843 | $48,339 | $14,040 | $34,299 |
| 2022 | $11,843 | $48,339 | $14,040 | $34,299 |
| 2021 | $12,493 | $44,833 | $7,722 | $37,111 |
| 2020 | $12,237 | $44,833 | $7,722 | $37,111 |
| 2019 | $12,223 | $49,982 | $7,722 | $42,260 |
| 2018 | $12,805 | $47,315 | $6,786 | $40,529 |
| 2017 | $13,188 | $49,105 | $6,786 | $42,319 |
| 2016 | $12,536 | $49,105 | $6,786 | $42,319 |
| 2015 | $11,631 | $42,015 | $5,850 | $36,165 |
| 2014 | $11,307 | $42,015 | $5,850 | $36,165 |
| 2013 | $12,786 | $45,755 | $5,850 | $39,905 |
Source: Public Records
Map
Nearby Homes
- 516 E Fairview St
- 527 E Mayfair Rd
- 606 S Arlington Heights Rd
- 407 S Pine Ave
- 630 S Beverly Ln
- 621 E Grove St
- 717 S Arlington Heights Rd
- 627 S Lincoln Ln
- 627 E Davis St
- 606 S Roosevelt Ave
- 216 S Evergreen Ave
- 207 S Evergreen Ave
- 819 S Beverly Ln
- 202 S Belmont Ave
- 206 S Belmont Ave
- 705 S Chestnut Ave
- 730 S Highland Ave
- 435 S Cleveland Ave Unit 307
- 831 S Dryden Place
- 213 S Dryden Place
- 423 E Mayfair Rd
- 411 E Mayfair Rd
- 407 E Mayfair Rd
- 416 E Fairview St
- 523 S Belmont Ave
- 404 E Fairview St
- 501 E Mayfair Rd
- 535 S Burton Place
- 537 S Burton Place
- 505 E Mayfair Rd
- 543 S Burton Place
- 411 E Fairview St
- 531 S Burton Place
- 500 E Fairview St
- 603 S Belmont Ave
- 511 E Mayfair Rd
- 515 S Belmont Ave
- 532 S Belmont Ave
- 530 S Belmont Ave
- 608 S Burton Place
Your Personal Tour Guide
Ask me questions while you tour the home.