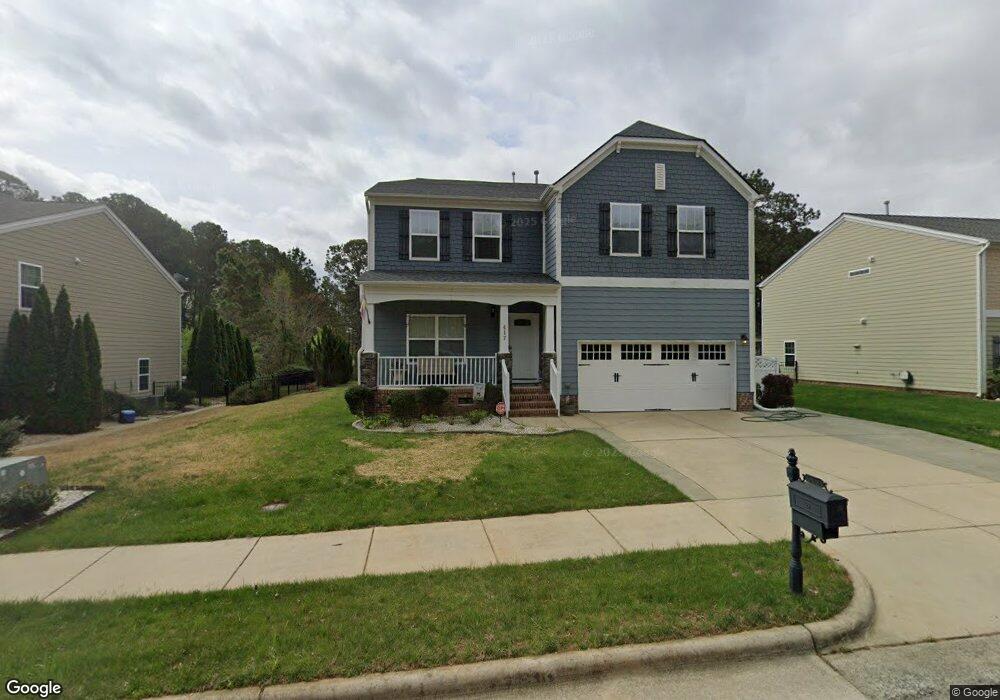
417 Field Glow Ln Apex, NC 27539
Middle Creek NeighborhoodEstimated Value: $615,716 - $663,000
5
Beds
3
Baths
2,803
Sq Ft
$228/Sq Ft
Est. Value
About This Home
This home is located at 417 Field Glow Ln, Apex, NC 27539 and is currently estimated at $639,179, approximately $228 per square foot. 417 Field Glow Ln is a home located in Wake County with nearby schools including West Lake Elementary School, West Lake Middle, and Middle Creek High.
Ownership History
Date
Name
Owned For
Owner Type
Purchase Details
Closed on
Oct 23, 2015
Sold by
Mason William T and Mason Rebekah S
Bought by
Mason Rebekah S
Current Estimated Value
Home Financials for this Owner
Home Financials are based on the most recent Mortgage that was taken out on this home.
Original Mortgage
$176,800
Outstanding Balance
$135,658
Interest Rate
3.25%
Mortgage Type
Adjustable Rate Mortgage/ARM
Estimated Equity
$503,521
Purchase Details
Closed on
Feb 27, 2013
Sold by
Buchanan Matthew D and Buchanan Tara M
Bought by
Mason William T and Mason Rebekah S
Home Financials for this Owner
Home Financials are based on the most recent Mortgage that was taken out on this home.
Original Mortgage
$19,000
Interest Rate
3.4%
Mortgage Type
New Conventional
Purchase Details
Closed on
Oct 23, 2009
Sold by
D R Horton Inc
Bought by
Buchanan Matthew D and Buchanan Tara M
Home Financials for this Owner
Home Financials are based on the most recent Mortgage that was taken out on this home.
Original Mortgage
$208,691
Interest Rate
5.03%
Mortgage Type
New Conventional
Create a Home Valuation Report for This Property
The Home Valuation Report is an in-depth analysis detailing your home's value as well as a comparison with similar homes in the area
Home Values in the Area
Average Home Value in this Area
Purchase History
| Date | Buyer | Sale Price | Title Company |
|---|---|---|---|
| Mason Rebekah S | -- | Attorney | |
| Mason William T | $273,000 | None Available | |
| Buchanan Matthew D | $261,000 | None Available |
Source: Public Records
Mortgage History
| Date | Status | Borrower | Loan Amount |
|---|---|---|---|
| Open | Mason Rebekah S | $176,800 | |
| Closed | Mason William T | $19,000 | |
| Previous Owner | Buchanan Matthew D | $208,691 |
Source: Public Records
Tax History Compared to Growth
Tax History
| Year | Tax Paid | Tax Assessment Tax Assessment Total Assessment is a certain percentage of the fair market value that is determined by local assessors to be the total taxable value of land and additions on the property. | Land | Improvement |
|---|---|---|---|---|
| 2025 | $4,886 | $567,783 | $137,500 | $430,283 |
| 2024 | $4,781 | $567,783 | $137,500 | $430,283 |
| 2023 | $3,559 | $353,178 | $75,000 | $278,178 |
| 2022 | $3,426 | $353,178 | $75,000 | $278,178 |
| 2021 | $3,358 | $353,178 | $75,000 | $278,178 |
| 2020 | $3,375 | $353,178 | $75,000 | $278,178 |
| 2019 | $3,297 | $306,096 | $84,000 | $222,096 |
| 2018 | $3,094 | $306,096 | $84,000 | $222,096 |
| 2017 | $2,951 | $303,685 | $84,000 | $219,685 |
| 2016 | $2,907 | $303,685 | $84,000 | $219,685 |
| 2015 | $3,101 | $312,986 | $86,000 | $226,986 |
| 2014 | -- | $312,986 | $86,000 | $226,986 |
Source: Public Records
Map
Nearby Homes
- 804 Blue Thorn Dr
- 5045 Homeplace Dr
- 212 Sea Biscuit Ln Unit 25
- 8401 Piney Branch Dr
- 8224 Bells Lake Rd
- 8220 Bells Lake Rd
- 8405 Bells Lake Rd
- 3909 Langston Cir
- 333 Calvander Ln
- 120 Corapeake Way
- 124 Corapeake Way
- 128 Corapeake Way
- 104 Corapeake Way
- 8844 Forester Ln
- 102 Jamison Woods Ln
- 6025 Larboard Dr
- 3628 Jamison Park Dr
- 8201 Rhodes Rd
- 3101 Sawyers Mill Dr
- 5340 Serene Forest Dr
- 421 Field Glow Ln
- 413 Field Glow Ln
- 425 Field Glow Ln
- 409 Field Glow Ln
- 429 Field Glow Ln
- 8328 Henderson Rd
- 8328 Henderson Rd Unit 1 & 2
- 405 Field Glow Ln
- 428 Field Glow Ln
- 433 Field Glow Ln
- 432 Field Glow Ln
- 108 Apple Branch Ct
- 437 Field Glow Ln
- 112 Apple Branch Ct
- 436 Field Glow Ln
- 8337 Henderson Rd
- 8337 Henderson Rd Unit LO59
- 8324 Henderson Rd
- 8316 Henderson Rd
- 104 Apple Branch Ct