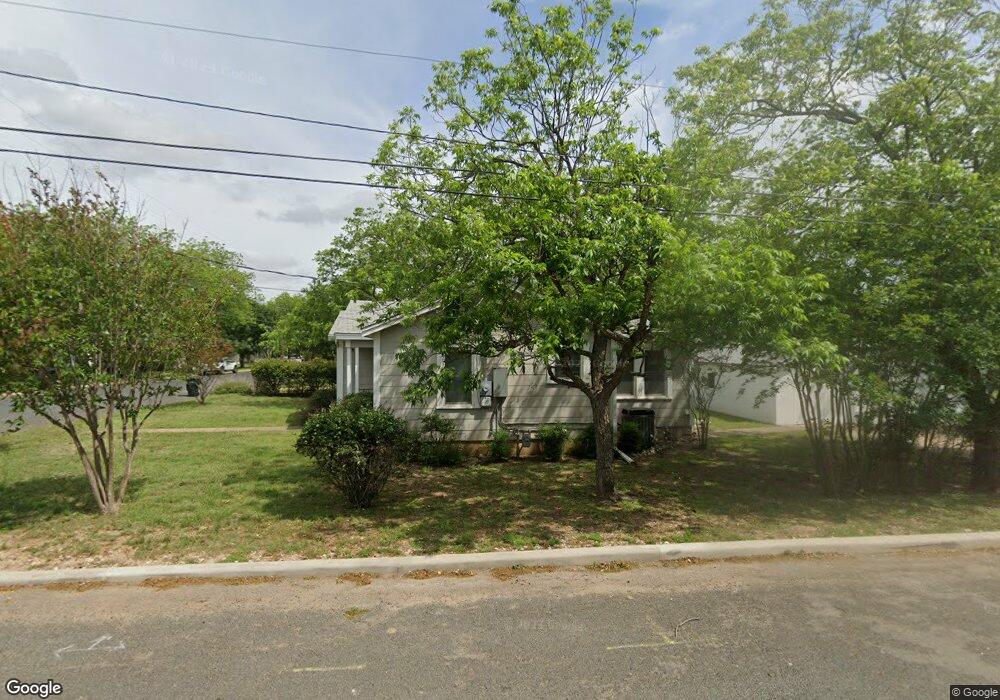
417 Fulton St Fredericksburg, TX 78624
Estimated Value: $357,102 - $453,000
--
Bed
--
Bath
852
Sq Ft
$487/Sq Ft
Est. Value
About This Home
This home is located at 417 Fulton St, Fredericksburg, TX 78624 and is currently estimated at $415,026, approximately $487 per square foot. 417 Fulton St is a home located in Gillespie County with nearby schools including Fredericksburg High School, Ambleside School of Fredericksburg, and St. Mary's Catholic School.
Ownership History
Date
Name
Owned For
Owner Type
Purchase Details
Closed on
Dec 7, 2024
Sold by
Bailey Lerinda Fay and Bailey Robert
Bought by
3 Of Harmony Llc
Current Estimated Value
Create a Home Valuation Report for This Property
The Home Valuation Report is an in-depth analysis detailing your home's value as well as a comparison with similar homes in the area
Home Values in the Area
Average Home Value in this Area
Purchase History
| Date | Buyer | Sale Price | Title Company |
|---|---|---|---|
| 3 Of Harmony Llc | -- | None Listed On Document | |
| 3 Of Harmony Llc | -- | None Listed On Document |
Source: Public Records
Tax History Compared to Growth
Tax History
| Year | Tax Paid | Tax Assessment Tax Assessment Total Assessment is a certain percentage of the fair market value that is determined by local assessors to be the total taxable value of land and additions on the property. | Land | Improvement |
|---|---|---|---|---|
| 2025 | $4,265 | $340,660 | $237,680 | $102,980 |
| 2024 | $4,265 | $339,780 | $237,680 | $102,100 |
| 2023 | $4,184 | $341,550 | $237,680 | $103,870 |
| 2022 | $4,211 | $281,740 | $181,760 | $99,980 |
| 2021 | $3,586 | $212,580 | $119,190 | $93,390 |
| 2020 | $3,210 | $186,390 | $104,900 | $81,490 |
| 2019 | $3,378 | $189,050 | $104,060 | $84,990 |
| 2018 | $2,979 | $167,480 | $90,330 | $77,150 |
| 2017 | $2,840 | $155,310 | $82,140 | $73,170 |
| 2016 | $2,616 | $143,050 | $82,140 | $60,910 |
| 2015 | -- | $130,200 | $75,060 | $55,140 |
| 2014 | -- | $98,620 | $44,400 | $54,220 |
Source: Public Records
Map
Nearby Homes
- Lot 2 Fulton St Unit 2
- 511 Bluebird St
- 404 Fulton St
- 420 S Milam St
- 603 Fulton St
- 309 Fulton St
- 707 Whitney St
- 414 Plum St Unit 21
- 204 W Peach St Unit 12
- 305 S Bowie St
- 506 Shaw Ave
- 516 W Creek St
- 207 S Bowie St
- 501 W San Antonio St
- 501 Mooney Ln
- 223 W Creek St
- 638 Post Oak Rd
- 212 W Peach St
- 202 S Bowie St
- 701 Wedgewood Ln
- 411 Fulton St
- 409 Fulton St
- 506 S Edison St
- 406 Whitney St
- 512 Fulton St
- 512 Fulton St Unit 6&7
- 416 Fulton St
- 505 Fulton St
- 414 Fulton St
- 412 Fulton St
- 502 Fulton St
- 405 Fulton St
- 410 Fulton St
- 506 Fulton St
- 507 Fulton St
- 511 Bluebird St Unit 2
- 405 Whitney St
- 406 Fulton St Unit 2
- 406 Fulton St
- 407 Whitney St