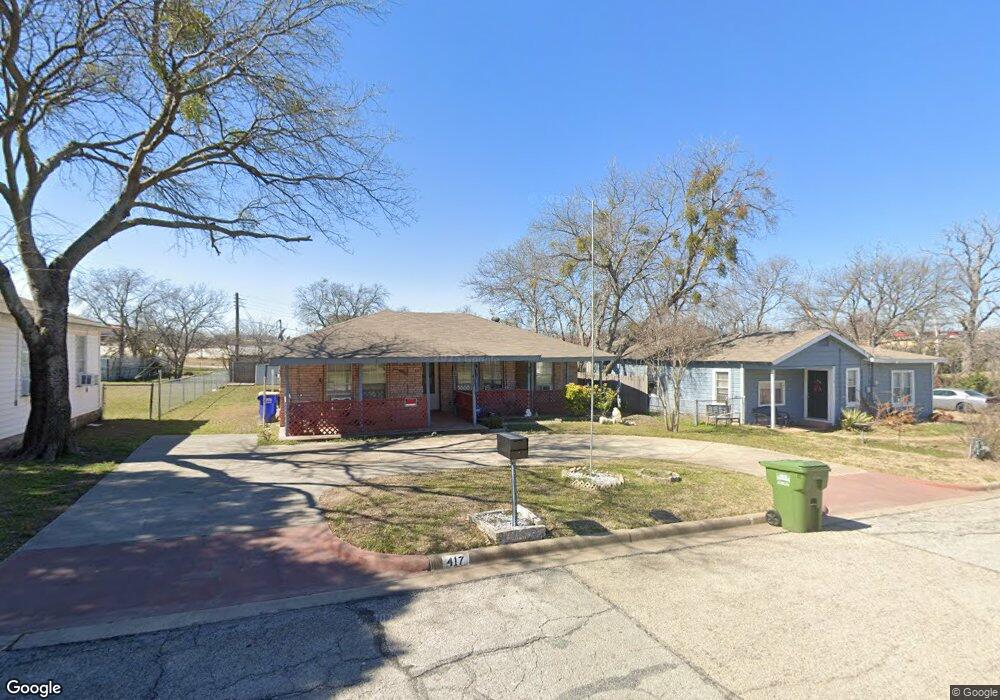
417 Hallvale Dr Fort Worth, TX 76108
Estimated Value: $233,000 - $253,000
3
Beds
2
Baths
1,156
Sq Ft
$210/Sq Ft
Est. Value
About This Home
This home is located at 417 Hallvale Dr, Fort Worth, TX 76108 and is currently estimated at $243,118, approximately $210 per square foot. 417 Hallvale Dr is a home located in Tarrant County with nearby schools including West Elementary School, Brewer Middle School, and Tannahill Intermediate School.
Ownership History
Date
Name
Owned For
Owner Type
Purchase Details
Closed on
Sep 26, 2001
Sold by
Ph & W Partners Inc
Bought by
Scott George A
Current Estimated Value
Home Financials for this Owner
Home Financials are based on the most recent Mortgage that was taken out on this home.
Original Mortgage
$74,411
Outstanding Balance
$29,106
Interest Rate
6.88%
Mortgage Type
FHA
Estimated Equity
$214,012
Purchase Details
Closed on
Jun 20, 2000
Sold by
Donias Billy J
Bought by
Ph & W Partners Inc
Home Financials for this Owner
Home Financials are based on the most recent Mortgage that was taken out on this home.
Original Mortgage
$43,149
Interest Rate
8.5%
Purchase Details
Closed on
Apr 29, 1996
Sold by
Thompson Gene A
Bought by
Donias Billy J
Create a Home Valuation Report for This Property
The Home Valuation Report is an in-depth analysis detailing your home's value as well as a comparison with similar homes in the area
Home Values in the Area
Average Home Value in this Area
Purchase History
| Date | Buyer | Sale Price | Title Company |
|---|---|---|---|
| Scott George A | -- | Alamo Title Company | |
| Ph & W Partners Inc | -- | Alamo Title Company | |
| Donias Billy J | -- | -- |
Source: Public Records
Mortgage History
| Date | Status | Borrower | Loan Amount |
|---|---|---|---|
| Open | Scott George A | $74,411 | |
| Previous Owner | Ph & W Partners Inc | $43,149 |
Source: Public Records
Tax History Compared to Growth
Tax History
| Year | Tax Paid | Tax Assessment Tax Assessment Total Assessment is a certain percentage of the fair market value that is determined by local assessors to be the total taxable value of land and additions on the property. | Land | Improvement |
|---|---|---|---|---|
| 2025 | $897 | $237,395 | $53,455 | $183,940 |
| 2024 | $897 | $237,395 | $53,455 | $183,940 |
| 2023 | $5,556 | $233,695 | $53,455 | $180,240 |
| 2022 | $3,390 | $183,285 | $31,250 | $152,035 |
| 2021 | $3,130 | $173,397 | $31,250 | $142,147 |
| 2020 | $2,867 | $148,055 | $31,250 | $116,805 |
| 2019 | $2,706 | $141,911 | $31,250 | $110,661 |
| 2018 | $1,949 | $85,502 | $15,000 | $70,502 |
| 2017 | $2,271 | $77,729 | $15,000 | $62,729 |
| 2016 | $2,475 | $102,268 | $15,000 | $87,268 |
| 2015 | $1,709 | $77,000 | $15,500 | $61,500 |
| 2014 | $1,709 | $77,000 | $15,500 | $61,500 |
Source: Public Records
Map
Nearby Homes
- 308 Hallvale Dr
- 304 Lockwood St
- 8814 Clifford St
- 201 N Normandale St
- 8401 Clifford St
- 203 East Place
- 105 Lockwood St
- 627 Hallvale Dr
- 204 Lanham Ct
- 8814 Rockway St
- 8321 Raymond Ave
- 9005 Glenn Dr
- 9104 White Settlement Rd
- 311 Russell St
- 9201 Clifford St
- 7945 White Settlement Rd
- 8402 Melrose St W
- 9200 Farmers Rd
- 9221 White Settlement Rd
- 633 Lariat Ln
- 419 Hallvale Dr
- 415 Hallvale Dr
- 412 N Las Vegas Trail
- 418 Hallvale Dr
- 414 Hallvale Dr
- 8712 Ronnie St
- 8708 Ronnie St
- 401 Hallvale Dr
- 408 N Las Vegas Trail
- 412 Hallvale Dr
- 8613 Jay St
- 420 N Las Vegas Trail
- 400 N Las Vegas Trail
- 8616 Ronnie St
- 8612 Ronnie St
- 8609 Jay St
- 424 N Las Vegas Trail
- 8612 Jay St
- 8608 Ronnie St
- 8707 Ronnie St