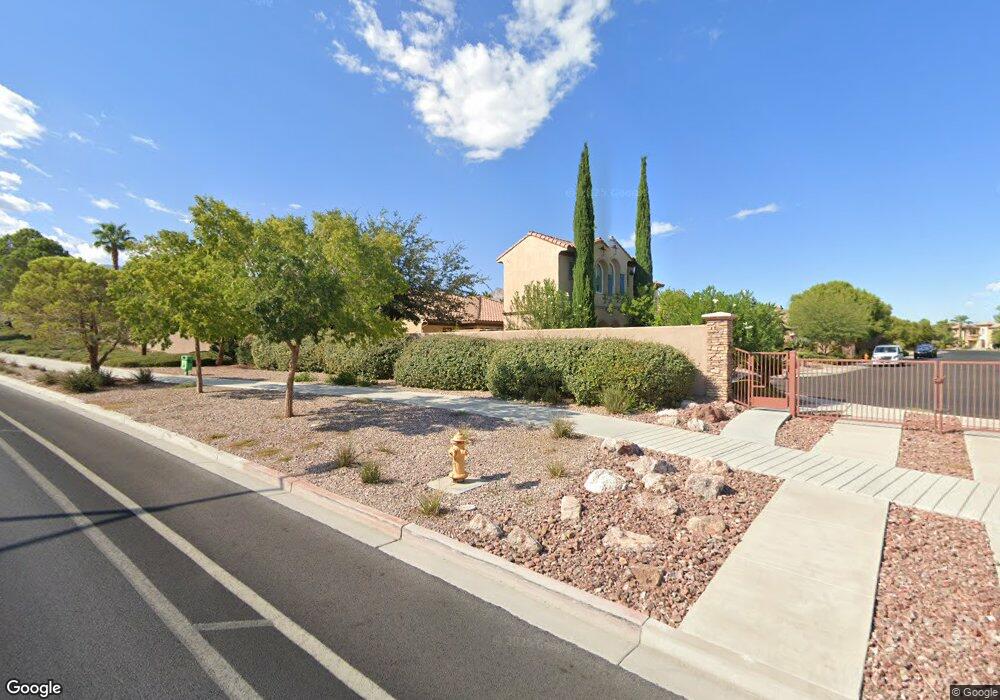
417 Lorelei Rock St Las Vegas, NV 89138
Summerlin NeighborhoodEstimated Value: $1,353,000 - $1,471,000
4
Beds
4
Baths
3,417
Sq Ft
$413/Sq Ft
Est. Value
About This Home
This home is located at 417 Lorelei Rock St, Las Vegas, NV 89138 and is currently estimated at $1,410,447, approximately $412 per square foot. 417 Lorelei Rock St is a home located in Clark County with nearby schools including Linda Rankin Givens Elementary School, Sig Rogich Middle School, and Palo Verde High School.
Ownership History
Date
Name
Owned For
Owner Type
Purchase Details
Closed on
Sep 3, 2020
Sold by
Marsh Kevin A and Marsh Weina Zhu
Bought by
Marsh Kevin A and Marsh Weina Zhu
Current Estimated Value
Home Financials for this Owner
Home Financials are based on the most recent Mortgage that was taken out on this home.
Original Mortgage
$510,400
Outstanding Balance
$451,916
Interest Rate
2.9%
Mortgage Type
New Conventional
Estimated Equity
$958,531
Purchase Details
Closed on
Aug 21, 2020
Sold by
Marsh Kevin A and Marsh Weina Zhu
Bought by
Marsh Kevin A and Marsh Weina Zhu
Home Financials for this Owner
Home Financials are based on the most recent Mortgage that was taken out on this home.
Original Mortgage
$510,400
Outstanding Balance
$451,916
Interest Rate
2.9%
Mortgage Type
New Conventional
Estimated Equity
$958,531
Purchase Details
Closed on
Oct 28, 2019
Sold by
Marsh Kevin A and Marsh Weina Zhu
Bought by
Marsh Kevin A and Marsh Weina Zhu
Purchase Details
Closed on
Oct 9, 2019
Sold by
Marsh Kevin A and Marsh Weina Zhu
Bought by
Marsh Kevin A and Marsh Weina Zhu
Purchase Details
Closed on
Dec 6, 2018
Sold by
Marsh Kevin
Bought by
Marsh Kevin and Marsh Weina Zhu
Purchase Details
Closed on
Mar 27, 2017
Sold by
Marsh Wina Zhu
Bought by
Marsh Kevin
Home Financials for this Owner
Home Financials are based on the most recent Mortgage that was taken out on this home.
Original Mortgage
$424,100
Interest Rate
4.17%
Mortgage Type
New Conventional
Purchase Details
Closed on
Feb 11, 2013
Sold by
Roberts Todd J
Bought by
Honey Badger Investments Series Ii Llc
Purchase Details
Closed on
Sep 16, 2005
Sold by
Rollband Elena
Bought by
Roberts Todd R
Purchase Details
Closed on
Apr 20, 2004
Sold by
Pn Ii Inc
Bought by
Rollband Elena
Home Financials for this Owner
Home Financials are based on the most recent Mortgage that was taken out on this home.
Original Mortgage
$478,712
Interest Rate
5.25%
Mortgage Type
Unknown
Create a Home Valuation Report for This Property
The Home Valuation Report is an in-depth analysis detailing your home's value as well as a comparison with similar homes in the area
Home Values in the Area
Average Home Value in this Area
Purchase History
| Date | Buyer | Sale Price | Title Company |
|---|---|---|---|
| Marsh Kevin A | -- | Stewart Title Company | |
| Marsh Kevin A | -- | Stewart Title Company F | |
| Marsh Kevin A | -- | First American Title | |
| Marsh Kevin A | -- | First American Title | |
| Marsh Kevin | -- | None Available | |
| Marsh Kevin | -- | Lawyers Title Of Nevada Cha | |
| Marsh Kevin | $750,000 | Lawyers Title Of Nevada | |
| Honey Badger Investments Series Ii Llc | -- | None Available | |
| Roberts Todd R | $910,000 | Equity Title Of Nevada | |
| Rollband Elena | $598,391 | Lawyers Title Of Nevada |
Source: Public Records
Mortgage History
| Date | Status | Borrower | Loan Amount |
|---|---|---|---|
| Open | Marsh Kevin A | $510,400 | |
| Closed | Marsh Kevin | $424,100 | |
| Previous Owner | Rollband Elena | $478,712 | |
| Closed | Rollband Elena | $89,758 |
Source: Public Records
Tax History Compared to Growth
Tax History
| Year | Tax Paid | Tax Assessment Tax Assessment Total Assessment is a certain percentage of the fair market value that is determined by local assessors to be the total taxable value of land and additions on the property. | Land | Improvement |
|---|---|---|---|---|
| 2025 | $7,017 | $324,620 | $128,258 | $196,362 |
| 2024 | $6,813 | $324,620 | $128,258 | $196,362 |
| 2023 | $5,555 | $265,709 | $81,218 | $184,491 |
| 2022 | $7,252 | $236,197 | $67,988 | $168,209 |
| 2021 | $6,713 | $222,813 | $62,475 | $160,338 |
| 2020 | $6,454 | $222,719 | $63,945 | $158,774 |
| 2019 | $6,048 | $217,499 | $61,373 | $156,126 |
| 2018 | $5,869 | $201,145 | $51,083 | $150,062 |
| 2017 | $6,610 | $201,288 | $49,980 | $151,308 |
| 2016 | $5,555 | $192,004 | $39,690 | $152,314 |
| 2015 | $5,546 | $179,064 | $37,118 | $141,946 |
| 2014 | $5,374 | $158,680 | $22,050 | $136,630 |
Source: Public Records
Map
Nearby Homes
- 11425 Rancho Portena Ave
- 11429 Orazio Dr
- 11421 Perugino Dr
- 212 Villa Borghese St
- 11388 Orazio Dr
- 11554 Trevi Fountain Ave
- 11550 Lampeter Ct
- 612 El Loro St
- 11245 Vintners Ln
- 561 Tecate Valley St
- 11248 Gibbs Hill Ave
- 11784 Golden Moments Ave
- 11612 Villa Malaparte Ave
- 11454 Crimson Ledge Ave
- 11442 Crimson Ledge Ave
- 11269 Emerald Pine Ln
- 11215 Ivybridge Ave
- 11204 Newbury Hills Ave
- 424 Vigo Port St
- 452 Crocus Hill St
- 413 Lorelei Rock St Unit 2
- 412 Morava St
- 11525 Balaton Lake Ave
- 412 Lorelei Rock St Unit 2
- 11509 Bohemian Forest Ave
- 11513 Bohemian Forest Ave
- 408 Lorelei Rock St Unit 2
- 11560 Aruba Beach Ave
- 11529 Balaton Lake Ave
- 11564 Aruba Beach Ave
- 11517 Bohemian Forest Ave
- 11556 Aruba Beach Ave
- 11556 Aruba Beach Ave Unit HOME
- 11568 Aruba Beach Ave Unit 3
- 11572 Aruba Beach Ave
- 404 Lorelei Rock St Unit 2
- 11548 Aruba Beach Ave Unit n/a
- 11548 Aruba Beach Ave
- 11576 Aruba Beach Ave
- 11576 Aruba Beach Ave