Estimated Value: $799,000 - $951,475
--
Bed
1
Bath
5,460
Sq Ft
$157/Sq Ft
Est. Value
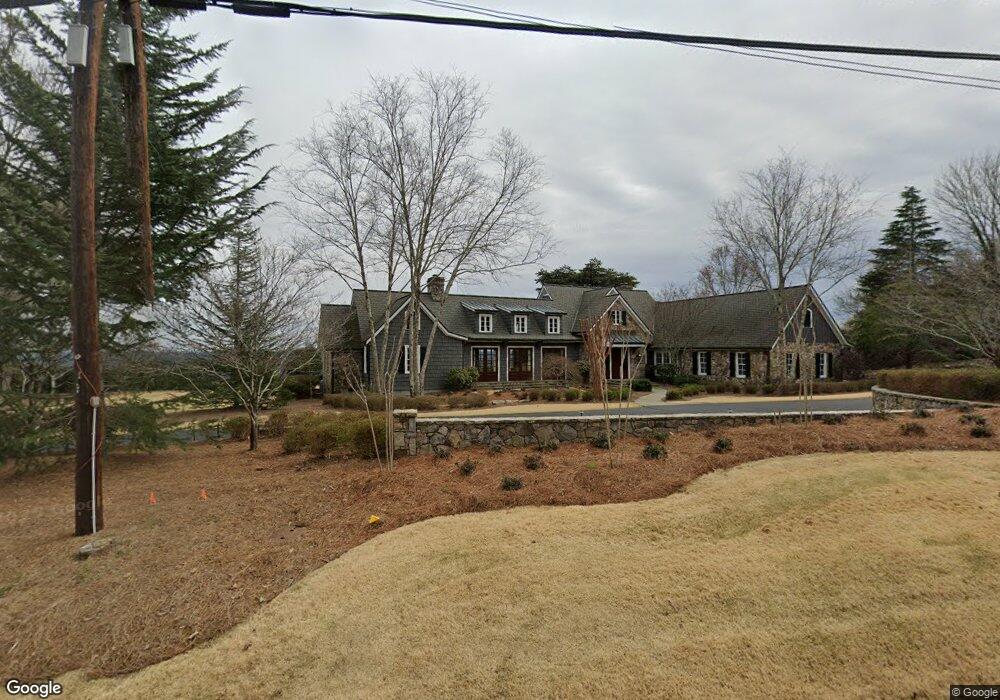
About This Home
This home is located at 417 Mount Alto Rd SW, Rome, GA 30165 and is currently estimated at $859,492, approximately $157 per square foot. 417 Mount Alto Rd SW is a home located in Floyd County with nearby schools including Coosa Middle School and Coosa High School.
Ownership History
Date
Name
Owned For
Owner Type
Purchase Details
Closed on
May 2, 2011
Sold by
Grizzard Bonnie L
Bought by
Grizzard Bonnie L
Current Estimated Value
Purchase Details
Closed on
Mar 2, 2000
Sold by
Corpe Elizabeth F
Bought by
Grizzard Bonnie
Purchase Details
Closed on
Feb 15, 1984
Sold by
P\R
Bought by
Corpe Elizabeth F
Purchase Details
Closed on
Aug 26, 1977
Sold by
Corpe Raymond F and Corpe Eliz F
Bought by
P\R
Purchase Details
Closed on
Aug 25, 1977
Sold by
Williams Dorothy Gardner
Bought by
Corpe Raymond F and Corpe Eliz F
Purchase Details
Closed on
Jul 31, 1976
Bought by
P and R
Purchase Details
Closed on
Dec 2, 1974
Sold by
P\R
Bought by
Williams Dorothy Gardner
Purchase Details
Closed on
Sep 13, 1969
Sold by
Williams Charle S
Bought by
P\R
Purchase Details
Closed on
Sep 12, 1969
Sold by
Enloe Van P
Bought by
Williams Charle S
Purchase Details
Closed on
Jan 1, 1956
Bought by
Enloe Van P
Create a Home Valuation Report for This Property
The Home Valuation Report is an in-depth analysis detailing your home's value as well as a comparison with similar homes in the area
Home Values in the Area
Average Home Value in this Area
Purchase History
| Date | Buyer | Sale Price | Title Company |
|---|---|---|---|
| Grizzard Bonnie L | -- | -- | |
| Grizzard Bonnie | $220,000 | -- | |
| Corpe Elizabeth F | -- | -- | |
| P\R | -- | -- | |
| Corpe Raymond F | $101,000 | -- | |
| P | -- | -- | |
| Williams Dorothy Gardner | -- | -- | |
| P\R | -- | -- | |
| Williams Charle S | $25,000 | -- | |
| Enloe Van P | -- | -- |
Source: Public Records
Tax History Compared to Growth
Tax History
| Year | Tax Paid | Tax Assessment Tax Assessment Total Assessment is a certain percentage of the fair market value that is determined by local assessors to be the total taxable value of land and additions on the property. | Land | Improvement |
|---|---|---|---|---|
| 2024 | $14,184 | $463,643 | $32,625 | $431,018 |
| 2023 | $13,265 | $448,062 | $29,000 | $419,062 |
| 2022 | $11,226 | $378,378 | $24,166 | $354,212 |
| 2021 | $10,480 | $347,220 | $24,166 | $323,054 |
| 2020 | $9,958 | $327,165 | $18,125 | $309,040 |
| 2019 | $8,674 | $288,781 | $18,125 | $270,656 |
| 2018 | $8,277 | $275,110 | $18,125 | $256,985 |
| 2017 | $8,074 | $267,826 | $18,125 | $249,701 |
| 2016 | $8,052 | $263,882 | $18,120 | $245,762 |
| 2015 | $7,874 | $263,882 | $18,120 | $245,762 |
| 2014 | $7,874 | $263,882 | $18,120 | $245,762 |
Source: Public Records
Map
Nearby Homes
- 202 Green View Rd SW
- 0 Hidden Ridge Dr Unit 10556470
- 0 Hidden Ridge Dr Unit 10343706
- 0 Hidden Ridge Dr Unit 10343701
- 0 Hidden Ridge Dr Unit 10343700
- 0 Hidden Ridge Dr Unit 10343696
- 0 Hidden Ridge Dr Unit 10343694
- 0 Hidden Ridge Dr Unit 10343693
- 0 Hidden Ridge Dr Unit 10343689
- 0 Hidden Ridge Dr Unit 10343688
- 0 Hidden Ridge Dr Unit 10343685
- 0 Hidden Ridge Dr Unit 10343680
- 0 Hidden Ridge Dr Unit 10343676
- 11 Brow Rd SW
- 5 Andrea Ct SW
- 28 Crestwood Dr SW
- 0 Featherston Rd SW Unit 10512723
- 0 Featherston Rd SW Unit 13890394
- 20 Pine Valley Rd SW
- 27 Bluff Mountain Dr SW
- 419 Mount Alto Rd SW
- 422 Mt Alto Rd
- 422 Mount Alto Rd SW
- 421 Mount Alto Rd SW
- 411 Mount Alto Rd SW
- 411 Mt Alto Rd SW
- 412 Mount Alto Rd SW
- 424 Mount Alto Rd SW
- 409 Mount Alto Rd SW
- 433 Mount Alto Rd SW
- 435 Mount Alto Rd SW
- 435 Mount Alto Rd SW
- 435 Mt Alto Rd SW
- 408 Mount Alto Rd SW
- 408 Mount Alto Rd SW
- 407 Mount Alto Rd SW
- 418 Mount Alto Rd SW
- 439 Mount Alto Rd SW
- 405 Mount Alto Rd SW
- 340 Featherston Rd SW