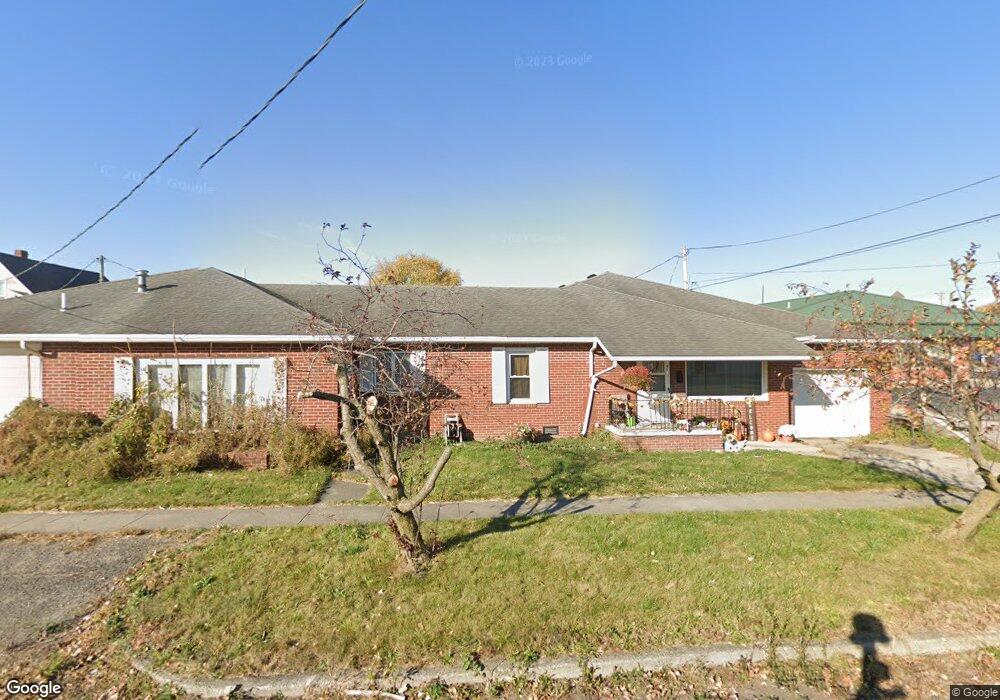
417 N Canal St Unit 419 Delphos, OH 45833
Estimated Value: $155,000 - $201,852
3
Beds
4
Baths
3,054
Sq Ft
$56/Sq Ft
Est. Value
About This Home
This home is located at 417 N Canal St Unit 419, Delphos, OH 45833 and is currently estimated at $169,963, approximately $55 per square foot. 417 N Canal St Unit 419 is a home located in Van Wert County with nearby schools including Delphos St. John's High School and Delphos St. John's Elementary School.
Ownership History
Date
Name
Owned For
Owner Type
Purchase Details
Closed on
Apr 11, 2005
Sold by
Kroeger Gerald J
Bought by
Metcalfe James R
Current Estimated Value
Home Financials for this Owner
Home Financials are based on the most recent Mortgage that was taken out on this home.
Original Mortgage
$80,325
Outstanding Balance
$40,478
Interest Rate
5.62%
Mortgage Type
Adjustable Rate Mortgage/ARM
Estimated Equity
$129,485
Purchase Details
Closed on
Apr 13, 2004
Bought by
Metcalfe James R
Create a Home Valuation Report for This Property
The Home Valuation Report is an in-depth analysis detailing your home's value as well as a comparison with similar homes in the area
Home Values in the Area
Average Home Value in this Area
Purchase History
| Date | Buyer | Sale Price | Title Company |
|---|---|---|---|
| Metcalfe James R | $47,250 | None Available | |
| Metcalfe James R | $94,500 | -- | |
| Metcalfe James R | $94,500 | -- |
Source: Public Records
Mortgage History
| Date | Status | Borrower | Loan Amount |
|---|---|---|---|
| Open | Metcalfe James R | $80,325 |
Source: Public Records
Tax History Compared to Growth
Tax History
| Year | Tax Paid | Tax Assessment Tax Assessment Total Assessment is a certain percentage of the fair market value that is determined by local assessors to be the total taxable value of land and additions on the property. | Land | Improvement |
|---|---|---|---|---|
| 2024 | $1,617 | $57,530 | $3,750 | $53,780 |
| 2023 | $1,617 | $57,530 | $3,750 | $53,780 |
| 2022 | $1,245 | $40,420 | $2,950 | $37,470 |
| 2021 | $1,249 | $40,420 | $2,950 | $37,470 |
| 2020 | $1,284 | $40,420 | $2,950 | $37,470 |
| 2019 | $1,033 | $36,100 | $2,950 | $33,150 |
| 2018 | $1,038 | $36,100 | $2,950 | $33,150 |
| 2017 | $1,041 | $36,100 | $2,950 | $33,150 |
| 2016 | $933 | $32,870 | $2,950 | $29,920 |
| 2015 | $933 | $32,870 | $2,950 | $29,920 |
| 2014 | $980 | $32,870 | $2,950 | $29,920 |
| 2013 | $1,058 | $32,870 | $2,950 | $29,920 |
Source: Public Records
Map
Nearby Homes
- 210 E 3rd St
- 405 N Franklin St
- 610 N Washington St
- 409 N Bredeick St
- 604 W 6th St
- 704 N Franklin St
- 810 N Franklin St
- 221 S Main St
- 424 S Canal St
- 633 E 2nd St
- 483 S Franklin St
- 516 S Main St
- 634 S Clay St
- 521 Carolyn Dr
- 827 S Washington St
- 1303 Carolyn Dr
- 1220 Rose Anna Dr
- 1001 S Adams St
- 1400 S Clay St Unit 17
- 7110 Elida Rd