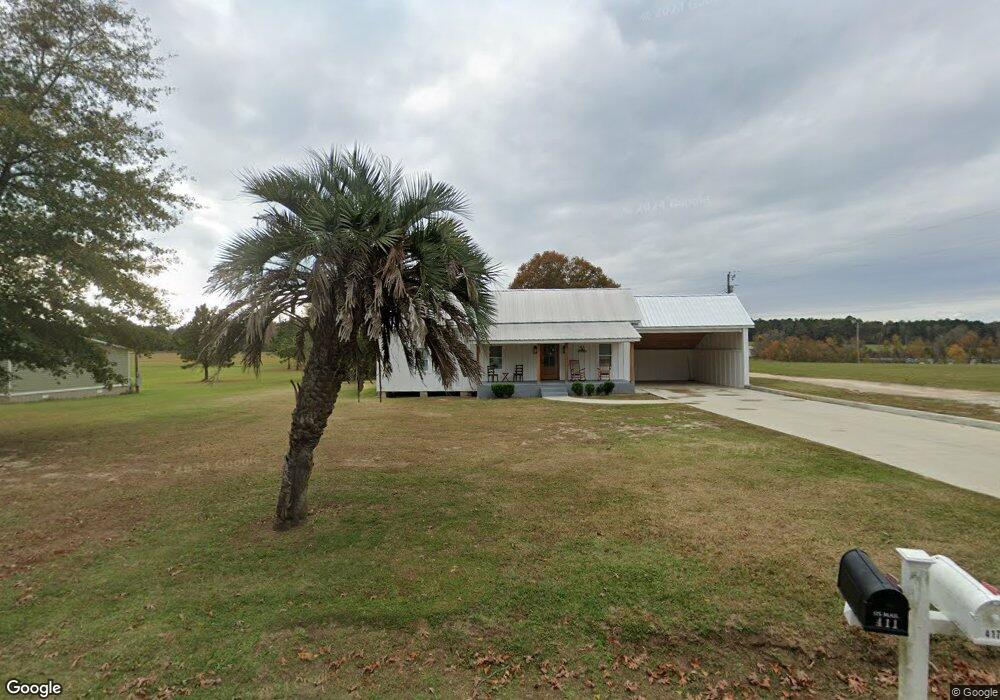
417 Peat Moss Loop Sylvania, GA 30467
Estimated Value: $77,023 - $186,000
--
Bed
1
Bath
1,128
Sq Ft
$110/Sq Ft
Est. Value
About This Home
This home is located at 417 Peat Moss Loop, Sylvania, GA 30467 and is currently estimated at $124,506, approximately $110 per square foot. 417 Peat Moss Loop is a home located in Screven County with nearby schools including Screven County Elementary School, Screven County Middle School, and Screven County High School.
Ownership History
Date
Name
Owned For
Owner Type
Purchase Details
Closed on
Oct 13, 2022
Sold by
Bolton Jonathan Isaac
Bought by
Cannon Charles A and Cannon Julia L
Current Estimated Value
Purchase Details
Closed on
Oct 22, 2019
Sold by
Cannon Charles A
Bought by
Bolton Jonathan Isaac
Home Financials for this Owner
Home Financials are based on the most recent Mortgage that was taken out on this home.
Original Mortgage
$30,012
Interest Rate
3.6%
Mortgage Type
New Conventional
Purchase Details
Closed on
Feb 7, 2019
Sold by
Scott Jeanene T
Bought by
Cannon Charles A and Cannon Julie L
Home Financials for this Owner
Home Financials are based on the most recent Mortgage that was taken out on this home.
Original Mortgage
$30,369
Interest Rate
4.4%
Mortgage Type
New Conventional
Purchase Details
Closed on
Nov 20, 1986
Bought by
Thompson Lary A
Create a Home Valuation Report for This Property
The Home Valuation Report is an in-depth analysis detailing your home's value as well as a comparison with similar homes in the area
Home Values in the Area
Average Home Value in this Area
Purchase History
| Date | Buyer | Sale Price | Title Company |
|---|---|---|---|
| Cannon Charles A | $25,676 | -- | |
| Bolton Jonathan Isaac | $32,500 | -- | |
| Cannon Charles A | $16,000 | -- | |
| Scott Jeanene T | -- | -- | |
| Vetta Jeanene T | -- | -- | |
| Thompson Vetta W | -- | -- | |
| Thompson Lary A | -- | -- |
Source: Public Records
Mortgage History
| Date | Status | Borrower | Loan Amount |
|---|---|---|---|
| Previous Owner | Bolton Jonathan Isaac | $30,012 | |
| Previous Owner | Thompson Vetta W | $30,369 |
Source: Public Records
Tax History Compared to Growth
Tax History
| Year | Tax Paid | Tax Assessment Tax Assessment Total Assessment is a certain percentage of the fair market value that is determined by local assessors to be the total taxable value of land and additions on the property. | Land | Improvement |
|---|---|---|---|---|
| 2024 | $1,204 | $38,920 | $1,760 | $37,160 |
| 2023 | $437 | $15,760 | $1,760 | $14,000 |
| 2022 | $564 | $14,840 | $1,720 | $13,120 |
| 2021 | $542 | $13,400 | $1,560 | $11,840 |
| 2020 | $534 | $12,720 | $1,560 | $11,160 |
| 2019 | $394 | $8,080 | $1,560 | $6,520 |
| 2018 | $226 | $7,880 | $1,560 | $6,320 |
| 2017 | $226 | $7,880 | $1,560 | $6,320 |
| 2016 | $340 | $7,932 | $1,560 | $6,372 |
| 2015 | -- | $7,892 | $1,560 | $6,332 |
| 2014 | -- | $7,732 | $1,560 | $6,172 |
| 2013 | -- | $7,732 | $1,560 | $6,172 |
Source: Public Records
Map
Nearby Homes
- 258 Beardsville Rd
- 938 Rifle Rd
- 837 Linger Long Rd
- 106 Lawton Place Dr
- 0 Friendship Rd Unit 10597657
- 0 Friendship Rd Unit SA339071
- LOT 125 Orange Ct
- 2304 Pine Grove Inn Rd
- 0 Buck Creek Rd Unit 10636216
- 254 Country Club Rd
- 378 Lawton Rd
- 315 Cork Pond Rd
- 0 Poor Robin Unit 329695
- 0 Burtons Ferry Hwy Unit 10475688
- 0 Burtons Ferry Hwy Unit 10549042
- 301 Beulah Rd
- 001 Beulah Rd
- 717 Lawton Rd
- 416 Abram St
- 0 Peeples Farm Rd Unit 10586522
- 407 Peat Moss Loop
- 410 Peat Moss Loop
- 411 Peat Moss Loop
- 438 Peat Moss Loop
- 379 Peat Moss Loop
- 465 Peat Moss Loop
- 1255 Mcbride Cir
- 244 Peat Moss Loop
- 646 Peat Moss Loop
- 634 Peat Moss Loop
- 645 Peat Moss Loop
- 592 Mcbride Cir
- 1155 Mcbride Cir
- 1305 Mcbride Cir
- 1274 Mcbride Cir
- 628 Peat Moss Loop
- 1385 Mcbride Cir
- 977 Mcbride Cir
- 1517 Mcbride Cir
- 935 Mcbride Cir