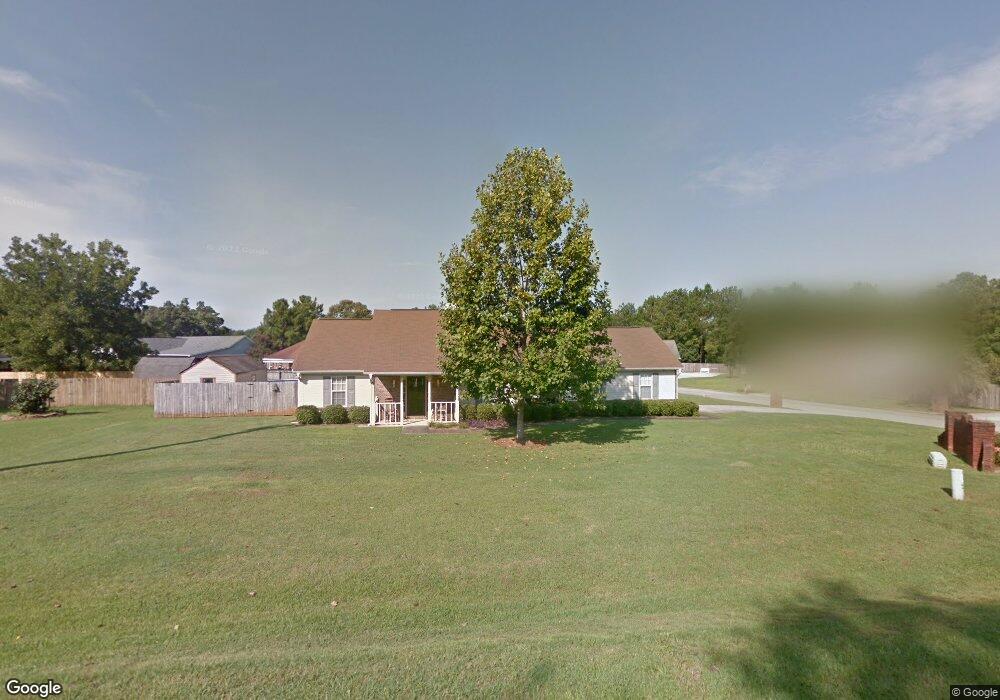
417 Tharpe Rd Warner Robins, GA 31088
Estimated Value: $252,000 - $274,000
3
Beds
3
Baths
1,705
Sq Ft
$153/Sq Ft
Est. Value
About This Home
This home is located at 417 Tharpe Rd, Warner Robins, GA 31088 and is currently estimated at $261,532, approximately $153 per square foot. 417 Tharpe Rd is a home located in Houston County with nearby schools including Quail Run Elementary School, Warner Robins Middle School, and Houston County High School.
Ownership History
Date
Name
Owned For
Owner Type
Purchase Details
Closed on
Mar 13, 2021
Sold by
Koth Regina Joy and King Regina
Bought by
Koth Regina Joy
Current Estimated Value
Home Financials for this Owner
Home Financials are based on the most recent Mortgage that was taken out on this home.
Original Mortgage
$100,000
Outstanding Balance
$58,354
Interest Rate
2.73%
Mortgage Type
New Conventional
Estimated Equity
$203,178
Purchase Details
Closed on
Aug 10, 2005
Sold by
Miglino Peter M
Bought by
King Regina
Purchase Details
Closed on
Jun 23, 2003
Sold by
Mitchell Donald B and Mitchell Jaydene
Bought by
Miglino Peter M
Purchase Details
Closed on
Mar 25, 1999
Sold by
Williamson Construction & Design
Bought by
Mitchell Donald B and Mitchell Jaydene P
Purchase Details
Closed on
Nov 9, 1998
Sold by
Quail Pointe Developers Inc
Bought by
Williamson Construction & Design Inc
Create a Home Valuation Report for This Property
The Home Valuation Report is an in-depth analysis detailing your home's value as well as a comparison with similar homes in the area
Home Values in the Area
Average Home Value in this Area
Purchase History
| Date | Buyer | Sale Price | Title Company |
|---|---|---|---|
| Koth Regina Joy | -- | First American Mortgage Sln | |
| Koth Regina Joy | -- | First American Title | |
| King Regina | $139,000 | -- | |
| Miglino Peter M | $130,000 | -- | |
| Mitchell Donald B | $123,700 | -- | |
| Williamson Construction & Design Inc | $15,300 | -- |
Source: Public Records
Mortgage History
| Date | Status | Borrower | Loan Amount |
|---|---|---|---|
| Open | Koth Regina Joy | $100,000 | |
| Closed | Koth Regina Joy | $100,000 |
Source: Public Records
Tax History Compared to Growth
Tax History
| Year | Tax Paid | Tax Assessment Tax Assessment Total Assessment is a certain percentage of the fair market value that is determined by local assessors to be the total taxable value of land and additions on the property. | Land | Improvement |
|---|---|---|---|---|
| 2024 | $1,845 | $79,120 | $9,600 | $69,520 |
| 2023 | $1,617 | $68,920 | $9,600 | $59,320 |
| 2022 | $1,481 | $63,280 | $9,600 | $53,680 |
| 2021 | $1,419 | $60,400 | $9,600 | $50,800 |
| 2020 | $1,330 | $56,480 | $9,600 | $46,880 |
| 2019 | $1,330 | $56,480 | $9,600 | $46,880 |
| 2018 | $1,330 | $56,480 | $9,600 | $46,880 |
| 2017 | $1,332 | $56,520 | $9,600 | $46,920 |
| 2016 | $1,334 | $56,520 | $9,600 | $46,920 |
| 2015 | $1,337 | $56,520 | $9,600 | $46,920 |
| 2014 | -- | $56,520 | $9,600 | $46,920 |
| 2013 | -- | $56,520 | $9,600 | $46,920 |
Source: Public Records
Map
Nearby Homes
- 406 Quail Run Dr
- 112 Scotsburg Dr
- 114 Wavertree Dr
- 108 Water Dr
- 122 Wavertree Dr
- 100 Athena Terrace
- 403 Wiltshire Ct
- 111 Glacier Trail
- 116 Joy Dr
- 103 Emberly Ln
- 320 Ellicott Dr
- 203 Morning Dove Ln
- 0 Lakeview Rd
- 115 Springtime Dr
- 3234 US Highway 41
- 204 Falkirk Dr
- 115 Flora Cir
- 0 Moracci Way Unit 24354552
- 322 Pheasant Ridge Dr
- 122 Halidon Dr
- 96 Whippoorwill Dr
- 415 Tharpe Rd
- 415 Tharpe Rd Unit 2
- 515 Tharpe Rd
- 100 Whippoorwill Dr
- 94 Whippoorwill Dr
- 97 Whippoorwill Dr
- 95 Whippoorwill Dr
- 101 Whippoorwill Dr
- 413 Tharpe Rd
- 517 Tharpe Rd
- 93 Whippoorwill Dr
- 412 Tharpe Rd
- 102 Whippoorwill Dr
- 92 Whippoorwill Dr
- 604 Tharpe Rd
- 503 Quail Run Dr
- 501 Quail Run Dr
- 407 Quail Run Dr
- 103 Whippoorwill Dr