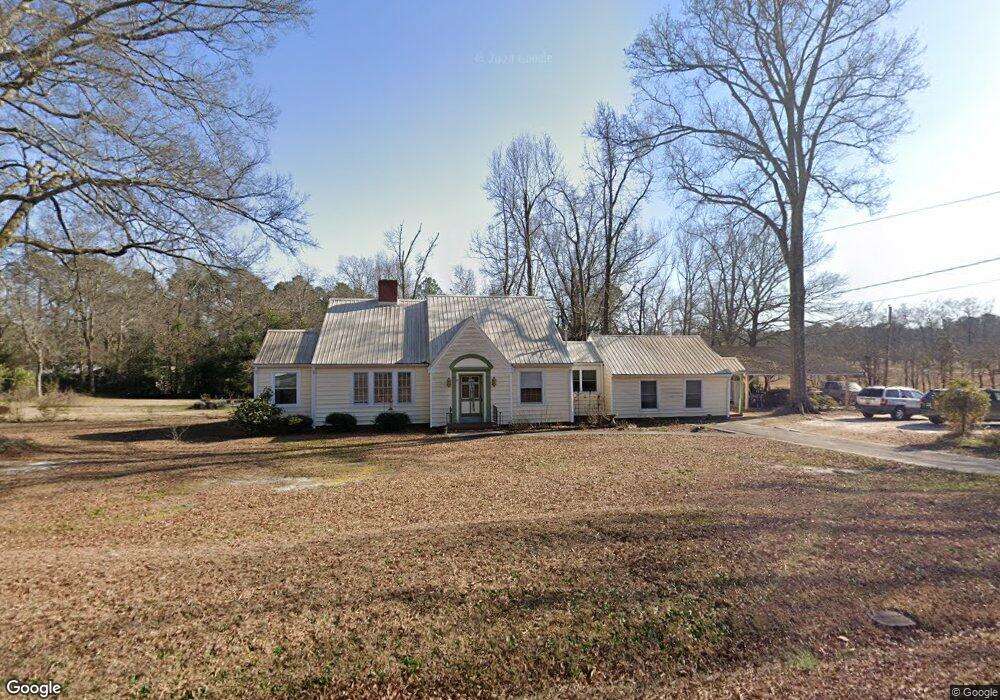
417 Westview Dr Thomson, GA 30824
Estimated Value: $252,000 - $296,000
3
Beds
2
Baths
2,451
Sq Ft
$112/Sq Ft
Est. Value
About This Home
This home is located at 417 Westview Dr, Thomson, GA 30824 and is currently estimated at $275,730, approximately $112 per square foot. 417 Westview Dr is a home located in McDuffie County with nearby schools including Thomson High School.
Ownership History
Date
Name
Owned For
Owner Type
Purchase Details
Closed on
Sep 15, 2025
Sold by
Lesney Jackie Lee
Bought by
Brown Curtis Scott
Current Estimated Value
Purchase Details
Closed on
Jul 29, 2024
Sold by
Lesney Jackie Lee
Bought by
Brown Curtis Scott and Lesney Jackie Lee
Purchase Details
Closed on
Feb 1, 2023
Sold by
Lesney Jackie Lee
Bought by
Lesney Iris
Purchase Details
Closed on
Dec 8, 2003
Sold by
Adkins Larose S
Bought by
Lesney Jackie Lee
Purchase Details
Closed on
Mar 11, 1985
Bought by
Adkins Larose S
Create a Home Valuation Report for This Property
The Home Valuation Report is an in-depth analysis detailing your home's value as well as a comparison with similar homes in the area
Home Values in the Area
Average Home Value in this Area
Purchase History
| Date | Buyer | Sale Price | Title Company |
|---|---|---|---|
| Brown Curtis Scott | -- | -- | |
| Lesney Jackie Lee | -- | -- | |
| Brown Curtis Scott | -- | -- | |
| Lesney Jackie Lee | -- | -- | |
| Lesney Iris | -- | -- | |
| Lesney Jackie Lee | $132,500 | -- | |
| Adkins Larose S | -- | -- |
Source: Public Records
Tax History Compared to Growth
Tax History
| Year | Tax Paid | Tax Assessment Tax Assessment Total Assessment is a certain percentage of the fair market value that is determined by local assessors to be the total taxable value of land and additions on the property. | Land | Improvement |
|---|---|---|---|---|
| 2025 | $2,630 | $105,589 | $10,296 | $95,293 |
| 2024 | $2,630 | $100,366 | $9,828 | $90,538 |
| 2023 | $2,574 | $83,500 | $9,360 | $74,140 |
| 2022 | $1,907 | $74,933 | $7,488 | $67,445 |
| 2021 | $1,483 | $62,428 | $9,360 | $53,068 |
| 2020 | $1,831 | $72,679 | $27,445 | $45,234 |
| 2019 | $1,855 | $72,858 | $27,445 | $45,413 |
| 2018 | $1,876 | $72,858 | $27,445 | $45,413 |
| 2017 | $1,820 | $72,858 | $27,445 | $45,413 |
| 2016 | $2,127 | $72,858 | $27,445 | $45,413 |
| 2015 | $1,864 | $72,543 | $27,445 | $45,098 |
| 2014 | $1,868 | $72,543 | $27,445 | $45,098 |
| 2013 | -- | $72,543 | $27,445 | $45,098 |
Source: Public Records
Map
Nearby Homes