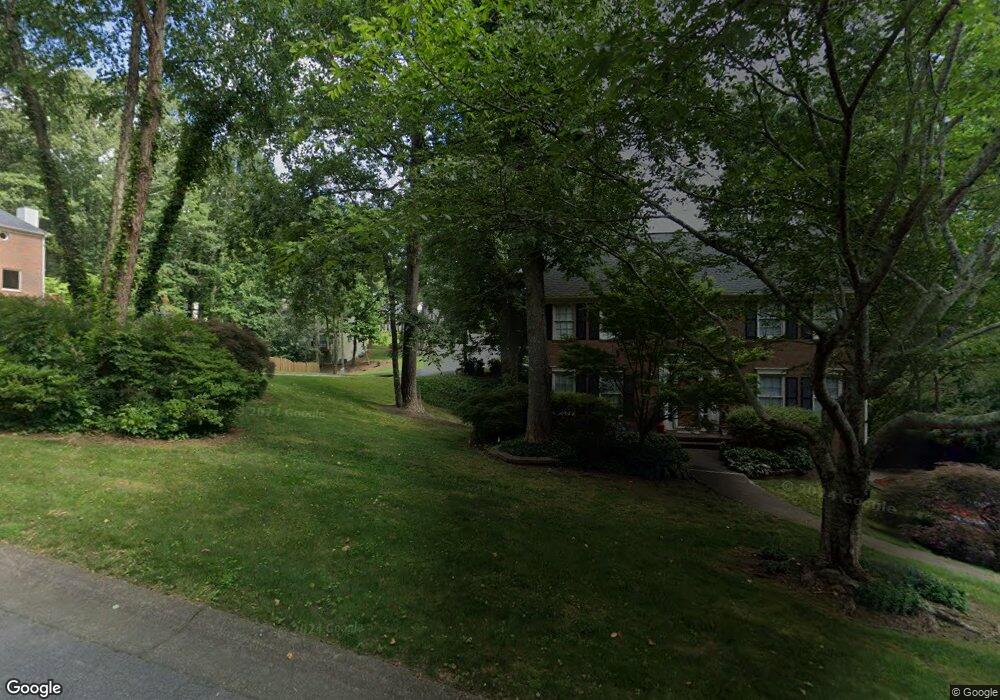
4170 Singing Post Ln NE Roswell, GA 30075
East Cobb NeighborhoodEstimated Value: $582,113 - $633,000
4
Beds
3
Baths
2,720
Sq Ft
$222/Sq Ft
Est. Value
About This Home
This home is located at 4170 Singing Post Ln NE, Roswell, GA 30075 and is currently estimated at $604,528, approximately $222 per square foot. 4170 Singing Post Ln NE is a home located in Cobb County with nearby schools including Shallowford Falls Elementary School, Simpson Middle School, and Lassiter High School.
Ownership History
Date
Name
Owned For
Owner Type
Purchase Details
Closed on
Nov 24, 2008
Sold by
Zierten Peter J
Bought by
Zierten Michelle
Current Estimated Value
Home Financials for this Owner
Home Financials are based on the most recent Mortgage that was taken out on this home.
Original Mortgage
$280,321
Outstanding Balance
$183,372
Interest Rate
6.01%
Mortgage Type
FHA
Estimated Equity
$421,156
Purchase Details
Closed on
Jul 23, 1993
Sold by
Gossett Keith C Gloria A
Bought by
Zierten Peter J Michelle
Home Financials for this Owner
Home Financials are based on the most recent Mortgage that was taken out on this home.
Original Mortgage
$134,900
Interest Rate
7.34%
Create a Home Valuation Report for This Property
The Home Valuation Report is an in-depth analysis detailing your home's value as well as a comparison with similar homes in the area
Home Values in the Area
Average Home Value in this Area
Purchase History
| Date | Buyer | Sale Price | Title Company |
|---|---|---|---|
| Zierten Michelle | -- | -- | |
| Zierten Peter J Michelle | $149,900 | -- |
Source: Public Records
Mortgage History
| Date | Status | Borrower | Loan Amount |
|---|---|---|---|
| Open | Zierten Michelle | $280,321 | |
| Previous Owner | Zierten Peter J Michelle | $134,900 |
Source: Public Records
Tax History Compared to Growth
Tax History
| Year | Tax Paid | Tax Assessment Tax Assessment Total Assessment is a certain percentage of the fair market value that is determined by local assessors to be the total taxable value of land and additions on the property. | Land | Improvement |
|---|---|---|---|---|
| 2025 | $4,900 | $211,124 | $52,000 | $159,124 |
| 2024 | $4,905 | $211,124 | $52,000 | $159,124 |
| 2023 | $3,737 | $182,336 | $40,800 | $141,536 |
| 2022 | $3,850 | $161,112 | $40,800 | $120,312 |
| 2021 | $3,578 | $148,668 | $38,800 | $109,868 |
| 2020 | $3,578 | $148,668 | $38,800 | $109,868 |
| 2019 | $3,229 | $132,728 | $33,600 | $99,128 |
| 2018 | $3,229 | $132,728 | $33,600 | $99,128 |
| 2017 | $2,795 | $117,096 | $33,600 | $83,496 |
| 2016 | $2,801 | $117,096 | $33,600 | $83,496 |
| 2015 | $2,476 | $99,996 | $34,800 | $65,196 |
| 2014 | $2,493 | $99,996 | $0 | $0 |
Source: Public Records
Map
Nearby Homes
- 4220 Singing Post Ln NE
- 4319 Summit Oaks Ln NE
- 3645 Lassiter Rd
- 4146 Chimney Lake Dr NE
- 4149 Barberry Dr NE
- 3810 Galloway Dr NE
- 3402 Johnson Ferry Rd NE
- 3968 Rock Mill Dr
- 3760 Loch Highland Pkwy NE
- 4505 Bastion Dr
- 4150 Chimney Heights NE
- 4509 Bastion Dr
- 3832 Wesley Chapel Rd
- 3262 Carriage Way
- 3935 Chapel Heights Dr
- 3856 Fenway Crossing
- 3990 Wesley Chapel Rd
- 4160 Singing Post Ln NE
- 4167 Kindlewood Ct NE
- 3598 Kindlewood Ln NE
- 0 Singing Post Ln NE Unit 7364441
- 0 Singing Post Ln NE Unit 7040291
- 0 Singing Post Ln NE Unit 7031489
- 0 Singing Post Ln NE Unit 8408874
- 4171 Singing Post Ln NE
- 0 Kindlewood Ct Unit 3286101
- 0 Kindlewood Ct Unit 8957388
- 0 Kindlewood Ct Unit 7421336
- 0 Kindlewood Ct Unit 7499990
- 4157 Kindlewood Ct NE
- 4161 Singing Post Ln NE
- 4187 Kindlewood Ct NE Unit 1
- 4191 Singing Post Ln NE Unit 1
- 4150 Singing Post Ln NE
- 4200 Singing Post Ln NE
- 3532 Nettle Ln NE
- 4197 Kindlewood Ct NE