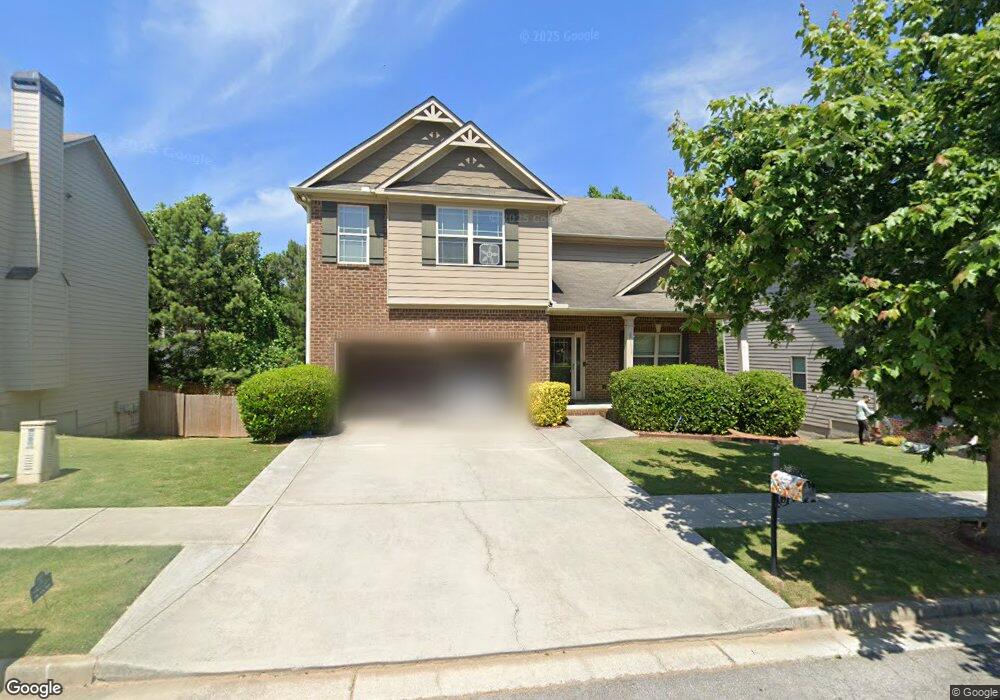
4170 Whitfield Oak Way NE Auburn, GA 30011
Estimated Value: $409,000 - $441,000
4
Beds
3
Baths
2,608
Sq Ft
$163/Sq Ft
Est. Value
About This Home
This home is located at 4170 Whitfield Oak Way NE, Auburn, GA 30011 and is currently estimated at $425,410, approximately $163 per square foot. 4170 Whitfield Oak Way NE is a home located in Gwinnett County with nearby schools including Mulberry Elementary School, Dacula Middle School, and Dacula High School.
Ownership History
Date
Name
Owned For
Owner Type
Purchase Details
Closed on
Apr 17, 2020
Sold by
Hainsel Justin Dean Carl
Bought by
Phillips Myasha R and Phillips Brian K
Current Estimated Value
Home Financials for this Owner
Home Financials are based on the most recent Mortgage that was taken out on this home.
Original Mortgage
$279,812
Outstanding Balance
$247,754
Interest Rate
3.6%
Mortgage Type
New Conventional
Estimated Equity
$177,656
Purchase Details
Closed on
May 13, 2016
Sold by
Mendez Joseph R
Bought by
Hainsel Justin Dean Carl
Home Financials for this Owner
Home Financials are based on the most recent Mortgage that was taken out on this home.
Original Mortgage
$206,100
Interest Rate
3.58%
Mortgage Type
New Conventional
Purchase Details
Closed on
Jun 25, 2014
Sold by
Rhg Homes Llc
Bought by
Mendez Joseph R and Mendez Natalie
Purchase Details
Closed on
Nov 15, 2013
Sold by
Brand Banking Co
Bought by
Rhg Homes Llc
Create a Home Valuation Report for This Property
The Home Valuation Report is an in-depth analysis detailing your home's value as well as a comparison with similar homes in the area
Home Values in the Area
Average Home Value in this Area
Purchase History
| Date | Buyer | Sale Price | Title Company |
|---|---|---|---|
| Phillips Myasha R | $275,000 | -- | |
| Hainsel Justin Dean Carl | $229,000 | -- | |
| Mendez Joseph R | $212,000 | -- | |
| Rhg Homes Llc | $150,000 | -- |
Source: Public Records
Mortgage History
| Date | Status | Borrower | Loan Amount |
|---|---|---|---|
| Open | Phillips Myasha R | $279,812 | |
| Previous Owner | Hainsel Justin Dean Carl | $206,100 |
Source: Public Records
Tax History Compared to Growth
Tax History
| Year | Tax Paid | Tax Assessment Tax Assessment Total Assessment is a certain percentage of the fair market value that is determined by local assessors to be the total taxable value of land and additions on the property. | Land | Improvement |
|---|---|---|---|---|
| 2025 | $5,565 | $191,360 | $30,000 | $161,360 |
| 2024 | $5,469 | $177,800 | $34,400 | $143,400 |
| 2023 | $5,469 | $177,800 | $34,400 | $143,400 |
| 2022 | $4,998 | $156,560 | $28,400 | $128,160 |
| 2021 | $4,062 | $110,000 | $22,000 | $88,000 |
| 2020 | $3,639 | $110,760 | $22,000 | $88,760 |
| 2019 | $3,279 | $98,800 | $17,600 | $81,200 |
| 2018 | $3,275 | $98,800 | $17,600 | $81,200 |
| 2016 | $2,841 | $78,480 | $15,600 | $62,880 |
| 2015 | $2,870 | $78,480 | $15,600 | $62,880 |
| 2014 | $649 | $10,800 | $10,800 | $0 |
Source: Public Records
Map
Nearby Homes
- 4165 Whitfield Oak Way
- 4050 Whitfield Oak Way
- 893 Whitfield Oak Rd
- 738 Key Largo Ct NE
- 858 W Union Grove Cir
- 753 Win Crossing W
- 692 W Union Grove Cir
- 4293 Saddlecreek Ct
- 4316 Azalea Ridge Way
- 4363 Saddlecreek Ct
- 1587 Cronic Town Rd Unit 1
- 2063 Blackberry Ln
- 4208 Sierra Creek Ct
- 873 Port West Dr
- 893 Port West Dr
- 723 York View Dr
- 2057 Blackberry Ln
- 738 York View Dr
- 270 E Union Grove Cir
- 41 Station Overlook Way
- 4170 Whitfield Oak Way Unit 32
- 4170 Whitfield Oak Way
- 4180 Whitfield Oak Way
- 4180 Whitfield Oak Way Unit 33
- 4160 Whitfield Oak Way Unit 31
- 4160 Whitfield Oak Way
- 953 Whitfield Oak Rd
- 4190 Whitfield Oak Way Unit 34
- 4190 Whitfield Oak Way
- 4175 Whitfield Oak Way
- 4150 Whitfield Oak Way
- 4150 Whitfield Oak Way Unit 30
- 4185 Whitfield Oak Way
- 943 Whitfield Oak Rd
- 943 Whitfield Oak Rd Unit 16
- 4165 Whitfield Oak Way Unit A/44
- 4155 Whitfield Oak
- 4195 Whitfield Oak Way Unit 41
- 4195 Whitfield Oak Way
- 4195 Whitfield Oak Way