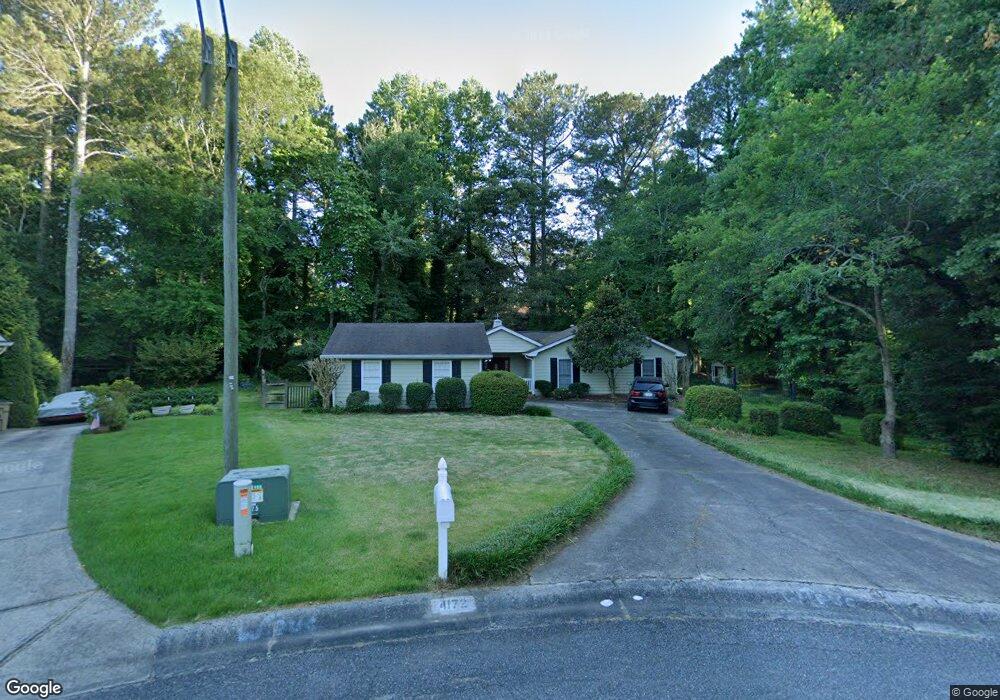
4172 Glen Ct NE Roswell, GA 30075
East Cobb NeighborhoodEstimated Value: $465,191 - $528,000
3
Beds
2
Baths
1,800
Sq Ft
$271/Sq Ft
Est. Value
About This Home
This home is located at 4172 Glen Ct NE, Roswell, GA 30075 and is currently estimated at $488,548, approximately $271 per square foot. 4172 Glen Ct NE is a home located in Cobb County with nearby schools including Garrison Mill Elementary School, Mabry Middle School, and Lassiter High School.
Ownership History
Date
Name
Owned For
Owner Type
Purchase Details
Closed on
Apr 26, 2002
Sold by
Ewing Ewing F and Ewing Caron W
Bought by
Squier James and Squier Barbara
Current Estimated Value
Home Financials for this Owner
Home Financials are based on the most recent Mortgage that was taken out on this home.
Original Mortgage
$162,000
Outstanding Balance
$68,242
Interest Rate
7.18%
Mortgage Type
New Conventional
Estimated Equity
$420,306
Purchase Details
Closed on
May 30, 1997
Sold by
Loding Vickie J
Bought by
Harding Daniel and Harding Bonnie
Home Financials for this Owner
Home Financials are based on the most recent Mortgage that was taken out on this home.
Original Mortgage
$126,176
Interest Rate
8.18%
Mortgage Type
FHA
Create a Home Valuation Report for This Property
The Home Valuation Report is an in-depth analysis detailing your home's value as well as a comparison with similar homes in the area
Home Values in the Area
Average Home Value in this Area
Purchase History
| Date | Buyer | Sale Price | Title Company |
|---|---|---|---|
| Squier James | $180,000 | -- | |
| Harding Daniel | $130,300 | -- |
Source: Public Records
Mortgage History
| Date | Status | Borrower | Loan Amount |
|---|---|---|---|
| Open | Squier James | $162,000 | |
| Previous Owner | Harding Daniel | $126,176 |
Source: Public Records
Tax History Compared to Growth
Tax History
| Year | Tax Paid | Tax Assessment Tax Assessment Total Assessment is a certain percentage of the fair market value that is determined by local assessors to be the total taxable value of land and additions on the property. | Land | Improvement |
|---|---|---|---|---|
| 2025 | $967 | $167,404 | $40,000 | $127,404 |
| 2024 | $971 | $167,404 | $40,000 | $127,404 |
| 2023 | $690 | $142,552 | $35,200 | $107,352 |
| 2022 | $866 | $132,524 | $31,600 | $100,924 |
| 2021 | $814 | $114,836 | $31,600 | $83,236 |
| 2020 | $782 | $104,272 | $30,000 | $74,272 |
| 2019 | $782 | $104,272 | $30,000 | $74,272 |
| 2018 | $722 | $84,296 | $28,000 | $56,296 |
| 2017 | $636 | $84,296 | $28,000 | $56,296 |
| 2016 | $628 | $80,868 | $28,000 | $52,868 |
| 2015 | $535 | $57,380 | $20,000 | $37,380 |
| 2014 | $547 | $57,380 | $0 | $0 |
Source: Public Records
Map
Nearby Homes
- 4587 Gilhams Rd NE
- 4579 Glenforest Dr NE
- 11140 West Rd
- 11180 West Rd
- 4440 Coventry Ct NE
- 3929 Fort Trail NE Unit 2
- 3865 Mabry Rd NE
- 4363 Old Mabry Rd NE
- 4361 Burnleigh Chase NE
- 4140 Westchester Crossing NE
- 4361 Old Mabry Ln NE
- 11395 West Rd
- 3985 Loch Highland Pass NE
- 11015 Stroup Rd
- 10955 Stroup Rd
- 4509 Bastion Dr
- 3760 Loch Highland Pkwy NE
- 4505 Bastion Dr
- 4544 Glenforest Dr NE Unit 2
- 4173 Glen Ct NE
- 4551 Gilhams Rd NE
- 4569 Gilhams Rd NE
- 4161 Forest Cir NE
- 4539 Gilhams Rd NE
- 4575 Gilhams Rd NE
- 4163 Glen Ct NE Unit 2
- 4171 Forest Cir NE Unit 2
- 4527 Gilhams Rd NE
- 4599 Gilhams Rd NE
- 4580 Glenforest Dr NE
- 4549 Glenforest Dr NE Unit 2
- 0 Forest Cir NE
- 4515 Gilhams Rd NE
- 4170 Forest Cir NE
- 82 Mabry Ln
- 4590 Gilhams Rd NE
- 4580 Gilhams Rd NE Unit 6
- 4569 Glenforest Dr NE