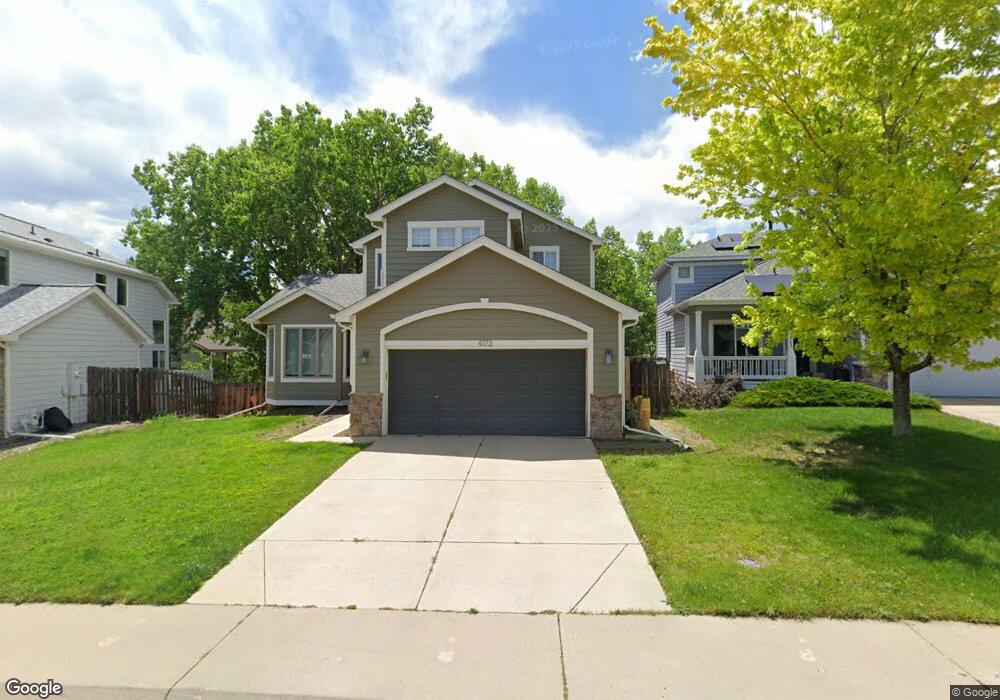
4173 S Deframe Ct Morrison, CO 80465
Willowbrook NeighborhoodEstimated Value: $790,000 - $850,000
4
Beds
4
Baths
3,207
Sq Ft
$255/Sq Ft
Est. Value
About This Home
This home is located at 4173 S Deframe Ct, Morrison, CO 80465 and is currently estimated at $817,375, approximately $254 per square foot. 4173 S Deframe Ct is a home located in Jefferson County with nearby schools including Kendallvue Elementary School, Carmody Middle School, and Bear Creek High School.
Ownership History
Date
Name
Owned For
Owner Type
Purchase Details
Closed on
Oct 1, 2021
Sold by
Eichelberg Thomas John and Eichelberg Lonni Jo
Bought by
Holmes Mark and Holmes Katherine K
Current Estimated Value
Home Financials for this Owner
Home Financials are based on the most recent Mortgage that was taken out on this home.
Original Mortgage
$399,000
Outstanding Balance
$363,851
Interest Rate
2.8%
Mortgage Type
New Conventional
Estimated Equity
$453,524
Purchase Details
Closed on
Dec 2, 2015
Sold by
Ives Associates Inc
Bought by
Eichelberg Thomas John and Eichelberg Lonni Jo
Home Financials for this Owner
Home Financials are based on the most recent Mortgage that was taken out on this home.
Original Mortgage
$389,160
Interest Rate
3.81%
Mortgage Type
New Conventional
Purchase Details
Closed on
Sep 1, 2015
Sold by
Rkvz 401K Plan
Bought by
Ives Associates Inc
Purchase Details
Closed on
Jun 19, 2015
Sold by
Mccliment Ralph J and Jpmorgan Chase Bank National A
Bought by
Ives Associates Inc and Rkvz 401K Plan
Purchase Details
Closed on
Oct 7, 1999
Sold by
Genesee Company
Bought by
Mccliment Ralph J and Mccliment Joyce M
Home Financials for this Owner
Home Financials are based on the most recent Mortgage that was taken out on this home.
Original Mortgage
$255,000
Interest Rate
7.75%
Create a Home Valuation Report for This Property
The Home Valuation Report is an in-depth analysis detailing your home's value as well as a comparison with similar homes in the area
Home Values in the Area
Average Home Value in this Area
Purchase History
| Date | Buyer | Sale Price | Title Company |
|---|---|---|---|
| Holmes Mark | $750,000 | Land Title Guarantee Company | |
| Eichelberg Thomas John | $423,000 | Title Assure Inc | |
| Ives Associates Inc | -- | None Available | |
| Ives Associates Inc | -- | None Available | |
| Mccliment Ralph J | $268,929 | Land Title |
Source: Public Records
Mortgage History
| Date | Status | Borrower | Loan Amount |
|---|---|---|---|
| Open | Holmes Mark | $399,000 | |
| Previous Owner | Eichelberg Thomas John | $389,160 | |
| Previous Owner | Mccliment Ralph J | $255,000 |
Source: Public Records
Tax History
| Year | Tax Paid | Tax Assessment Tax Assessment Total Assessment is a certain percentage of the fair market value that is determined by local assessors to be the total taxable value of land and additions on the property. | Land | Improvement |
|---|---|---|---|---|
| 2024 | $4,841 | $49,427 | $9,450 | $39,977 |
| 2023 | $4,841 | $49,427 | $9,450 | $39,977 |
| 2022 | $4,032 | $40,418 | $8,292 | $32,126 |
| 2021 | $4,083 | $41,582 | $8,531 | $33,051 |
| 2020 | $3,688 | $37,642 | $6,993 | $30,649 |
| 2019 | $3,642 | $37,642 | $6,993 | $30,649 |
| 2018 | $3,172 | $31,656 | $6,279 | $25,377 |
| 2017 | $2,895 | $31,656 | $6,279 | $25,377 |
| 2016 | $2,373 | $25,034 | $5,699 | $19,335 |
| 2015 | $2,322 | $25,034 | $5,699 | $19,335 |
| 2014 | $2,322 | $22,982 | $5,605 | $17,377 |
Source: Public Records
Map
Nearby Homes
- 4286 S Eldridge St Unit 202
- 14472 Pansy Loop
- 13826 W Layton Cir
- 4651 Talley St
- 4654 Cloudburst Ln
- 4682 Cloudburst Ln
- 4684 Cloudburst Ln
- 4651 Cloudburst Ln
- 4653 Cloudburst Ln
- 4663 Cloudburst Ln
- 14497 Saint Place
- 14519 Dove Song Ct
- 4590 S Braun Ct
- 14472 Tranquil Ct
- 4306 S Zinnia St
- 4899 N Daven Rd
- 14959 W Hampden Ave
- 4888 Noris Ave
- 4885 Noris Ave
- 4386 S Xenophon Way
- 4183 S Deframe Ct
- 4163 S Deframe Ct
- 4206 S Eldridge St Unit 312
- 4206 S Eldridge St Unit 311
- 4206 S Eldridge St Unit 310
- 4206 S Eldridge St Unit 208
- 4206 S Eldridge St Unit 207
- 4206 S Eldridge St Unit 206
- 4206 S Eldridge St Unit 205
- 4206 S Eldridge St Unit 104
- 4206 S Eldridge St Unit 103
- 4206 S Eldridge St Unit 102
- 4206 S Eldridge St Unit 101
- 4206 S Eldridge St Unit 4309
- 4211 S Deframe St
- 4153 S Deframe Ct
- 4191 S Deframe St
- 4221 S Deframe St
- 4216 S Eldridge St Unit 101
- 4216 S Eldridge St Unit 203
Your Personal Tour Guide
Ask me questions while you tour the home.