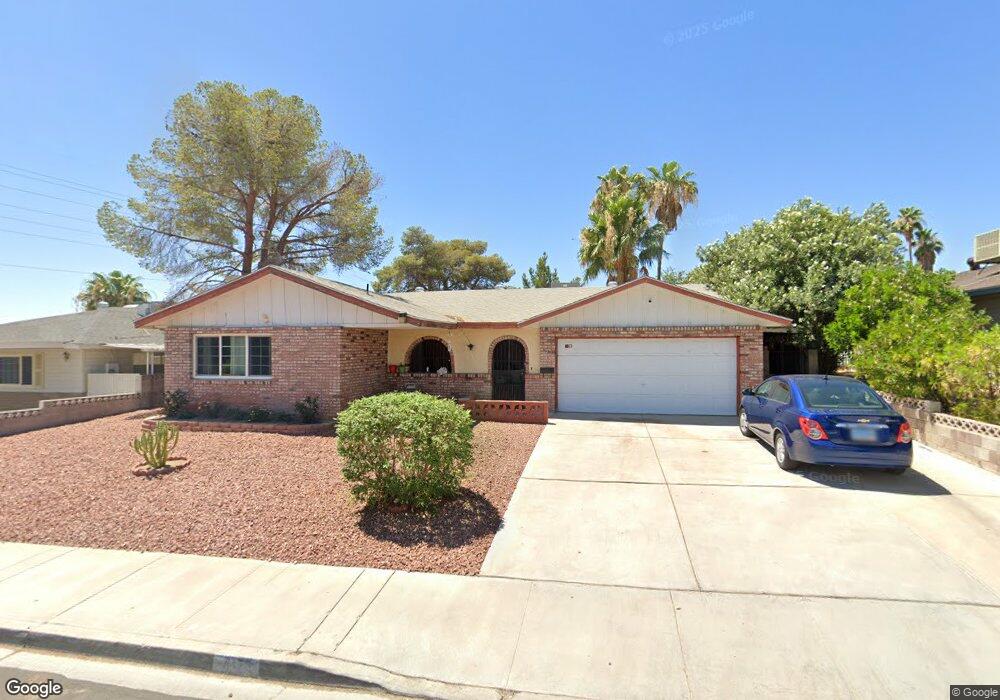
4173 Seattle Ave Las Vegas, NV 89121
Paradise Valley East NeighborhoodEstimated Value: $404,414 - $480,000
4
Beds
2
Baths
1,774
Sq Ft
$248/Sq Ft
Est. Value
About This Home
This home is located at 4173 Seattle Ave, Las Vegas, NV 89121 and is currently estimated at $440,104, approximately $248 per square foot. 4173 Seattle Ave is a home located in Clark County with nearby schools including William E. Ferron Elementary School, C.W. Woodbury Middle School, and Chaparral High School.
Ownership History
Date
Name
Owned For
Owner Type
Purchase Details
Closed on
Jun 25, 1998
Sold by
Espino Jorge A and Renteria Carlos
Bought by
Espino Jorge A and Renteria Carlos
Current Estimated Value
Home Financials for this Owner
Home Financials are based on the most recent Mortgage that was taken out on this home.
Original Mortgage
$111,810
Outstanding Balance
$23,220
Interest Rate
7.17%
Mortgage Type
FHA
Estimated Equity
$416,884
Purchase Details
Closed on
Mar 24, 1995
Sold by
Espino Carmen
Bought by
Espino Jorge A
Home Financials for this Owner
Home Financials are based on the most recent Mortgage that was taken out on this home.
Original Mortgage
$109,765
Interest Rate
8.86%
Mortgage Type
FHA
Purchase Details
Closed on
Mar 23, 1995
Sold by
Sansom Doyle P and Sansom Elizabeth
Bought by
Espino Jorge A and Renteria Carlos
Home Financials for this Owner
Home Financials are based on the most recent Mortgage that was taken out on this home.
Original Mortgage
$109,765
Interest Rate
8.86%
Mortgage Type
FHA
Create a Home Valuation Report for This Property
The Home Valuation Report is an in-depth analysis detailing your home's value as well as a comparison with similar homes in the area
Home Values in the Area
Average Home Value in this Area
Purchase History
| Date | Buyer | Sale Price | Title Company |
|---|---|---|---|
| Espino Jorge A | -- | Fidelity National Title | |
| Espino Jorge A | -- | -- | |
| Espino Jorge A | $111,000 | -- |
Source: Public Records
Mortgage History
| Date | Status | Borrower | Loan Amount |
|---|---|---|---|
| Open | Espino Jorge A | $111,810 | |
| Closed | Espino Jorge A | $109,765 |
Source: Public Records
Tax History Compared to Growth
Tax History
| Year | Tax Paid | Tax Assessment Tax Assessment Total Assessment is a certain percentage of the fair market value that is determined by local assessors to be the total taxable value of land and additions on the property. | Land | Improvement |
|---|---|---|---|---|
| 2025 | $1,635 | $58,606 | $32,200 | $26,406 |
| 2024 | $1,529 | $58,606 | $32,200 | $26,406 |
| 2023 | $1,529 | $59,182 | $35,350 | $23,832 |
| 2022 | $1,430 | $51,760 | $30,450 | $21,310 |
| 2021 | $1,589 | $46,862 | $25,900 | $20,962 |
| 2020 | $986 | $46,672 | $25,200 | $21,472 |
| 2019 | $924 | $44,266 | $22,400 | $21,866 |
| 2018 | $882 | $41,928 | $20,300 | $21,628 |
| 2017 | $1,194 | $40,717 | $18,200 | $22,517 |
| 2016 | $1,079 | $36,638 | $12,950 | $23,688 |
| 2015 | $1,076 | $34,444 | $10,500 | $23,944 |
| 2014 | $1,052 | $29,612 | $8,750 | $20,862 |
Source: Public Records
Map
Nearby Homes
- 4161 Oxnard Cir
- 3912 Ventura Way
- 4285 El Como Way
- 4310 El Antonio Place
- 4072 E Harmon Ave
- 3955 Ventura Way
- 4010 Syracuse Dr
- 4332 Del Santos Dr
- 4278 El Campana Way
- 4269 Cartegena Way
- 4356 Powell Ave
- 4356 Sabadell St
- 3948 Oakhill Ave
- 3982 Acapulco Ave
- 3961 Acapulco Ave
- 3917 Acapulco Ave
- 3919 Brighthill Ave
- 4062 Monthill Ave
- 3880 Springhill Ave
- 4458 El Quinta Ct
- 4161 Seattle Ave
- 4185 Seattle Ave
- 4185 Seattle Ave
- 4185 Seattle Ave
- 4185 Seattle Ave
- 4185 Seattle Ave
- 4174 Toronto Cir
- 4162 Toronto Cir
- 4149 Seattle Ave
- 4174 Seattle Ave Unit 3E
- 4150 Toronto Cir
- 4162 Seattle Ave
- 4186 Seattle Ave Unit 3E
- 4150 Seattle Ave
- 4137 Seattle Ave
- 4138 Seattle Ave
- 4173 Toronto Cir
- 4175 Vancouver Ave
- 4161 Toronto Cir
- 4165 Vancouver Ave