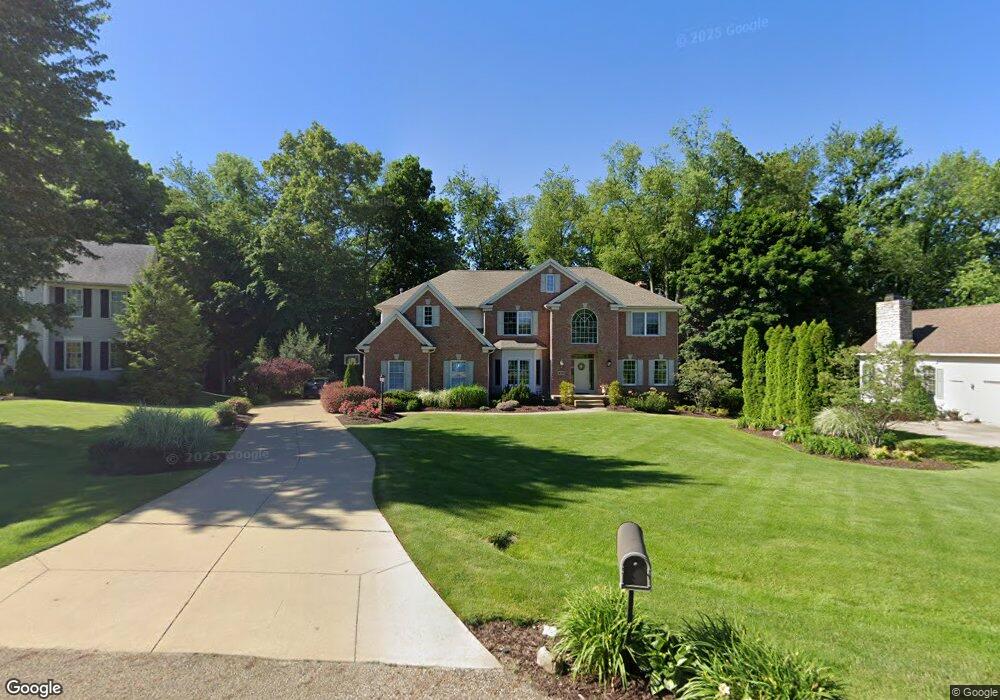
4176 Hawksfield Cir Copley, OH 44321
Estimated Value: $614,768 - $686,000
4
Beds
5
Baths
4,097
Sq Ft
$159/Sq Ft
Est. Value
About This Home
This home is located at 4176 Hawksfield Cir, Copley, OH 44321 and is currently estimated at $653,192, approximately $159 per square foot. 4176 Hawksfield Cir is a home located in Summit County with nearby schools including Copley-Fairlawn Middle School, Copley High School, and Fairlawn Lutheran School.
Ownership History
Date
Name
Owned For
Owner Type
Purchase Details
Closed on
Oct 21, 2005
Sold by
Taylor David V and Taylor Pauline C
Bought by
Kihn Jean Claude and Kihn Brigitte
Current Estimated Value
Home Financials for this Owner
Home Financials are based on the most recent Mortgage that was taken out on this home.
Original Mortgage
$360,000
Interest Rate
5.8%
Mortgage Type
Purchase Money Mortgage
Purchase Details
Closed on
Sep 20, 1999
Sold by
Prestige & Premier Companies
Bought by
Taylor David V and Taylor Pauline C
Home Financials for this Owner
Home Financials are based on the most recent Mortgage that was taken out on this home.
Original Mortgage
$80,000
Interest Rate
7.91%
Mortgage Type
Balloon
Purchase Details
Closed on
Jun 10, 1997
Sold by
Kingsbury Trace Dev Co
Bought by
Prestige & Premier Co
Home Financials for this Owner
Home Financials are based on the most recent Mortgage that was taken out on this home.
Original Mortgage
$104,800
Interest Rate
8.17%
Mortgage Type
New Conventional
Create a Home Valuation Report for This Property
The Home Valuation Report is an in-depth analysis detailing your home's value as well as a comparison with similar homes in the area
Home Values in the Area
Average Home Value in this Area
Purchase History
| Date | Buyer | Sale Price | Title Company |
|---|---|---|---|
| Kihn Jean Claude | $470,000 | First American Title Ins Co | |
| Taylor David V | $437,730 | Meridian Title | |
| Prestige & Premier Co | $69,900 | -- |
Source: Public Records
Mortgage History
| Date | Status | Borrower | Loan Amount |
|---|---|---|---|
| Closed | Kihn Jean Claude | $360,000 | |
| Closed | Taylor David V | $80,000 | |
| Previous Owner | Prestige & Premier Co | $104,800 |
Source: Public Records
Tax History Compared to Growth
Tax History
| Year | Tax Paid | Tax Assessment Tax Assessment Total Assessment is a certain percentage of the fair market value that is determined by local assessors to be the total taxable value of land and additions on the property. | Land | Improvement |
|---|---|---|---|---|
| 2025 | $10,074 | $179,095 | $33,894 | $145,201 |
| 2024 | $9,594 | $179,095 | $33,894 | $145,201 |
| 2023 | $10,074 | $179,095 | $33,894 | $145,201 |
| 2022 | $9,235 | $141,124 | $26,688 | $114,436 |
| 2021 | $8,529 | $141,124 | $26,688 | $114,436 |
| 2020 | $8,327 | $141,130 | $26,690 | $114,440 |
| 2019 | $8,534 | $130,480 | $26,690 | $103,790 |
| 2018 | $8,120 | $130,480 | $26,690 | $103,790 |
| 2017 | $7,859 | $130,480 | $26,690 | $103,790 |
| 2016 | $7,785 | $121,200 | $26,690 | $94,510 |
| 2015 | $7,859 | $121,200 | $26,690 | $94,510 |
| 2014 | $7,805 | $121,200 | $26,690 | $94,510 |
| 2013 | $8,407 | $133,570 | $24,900 | $108,670 |
Source: Public Records
Map
Nearby Homes
- 4212 Devonshire Ct
- 892 Clearwood Rd
- 4417 Wyndham Way
- 4467 Briarwood Dr
- 4388 Wedgewood Dr
- 425 S Hametown Rd
- 521 Weston Ct
- 4038 Gardiner Run
- 991 Croghan Way
- 498 Weston Ct
- 3974 Gardiner Run
- 389 Caleb Dr
- 522 Robinwood Ln Unit I
- 3888 Gardiner Run
- 4496 Millbrook Way
- 483 Rothrock Rd
- 649 S Medina Line Rd
- 3800 Rosemont Blvd Unit 111B
- 3800 Rosemont Blvd Unit 105G
- 3800 Rosemont Blvd Unit 101G
- 4184 Hawksfield Cir
- 4168 Hawksfield Cir
- 4095 Stonebridge Blvd
- 4192 Hawksfield Cir
- 4160 Hawksfield Cir
- 4160 Hawksfield Kb75
- 4077 Stonebridge Blvd
- 4153 Hawksfield Cir
- 773 Kensington Way
- 4171 Hawksfield Cir
- 753 Kensington Way
- 4161 Hawksfield Cir
- 742 Salisbury Way
- 4181 Hawksfield Cir
- 750 Salisbury Way
- 734 Salisbury Way
- 4191 Hawksfield Cir
- 6547 Stonebridge Blvd
- 726 Salisbury Way
- 4069 Stonebridge Blvd