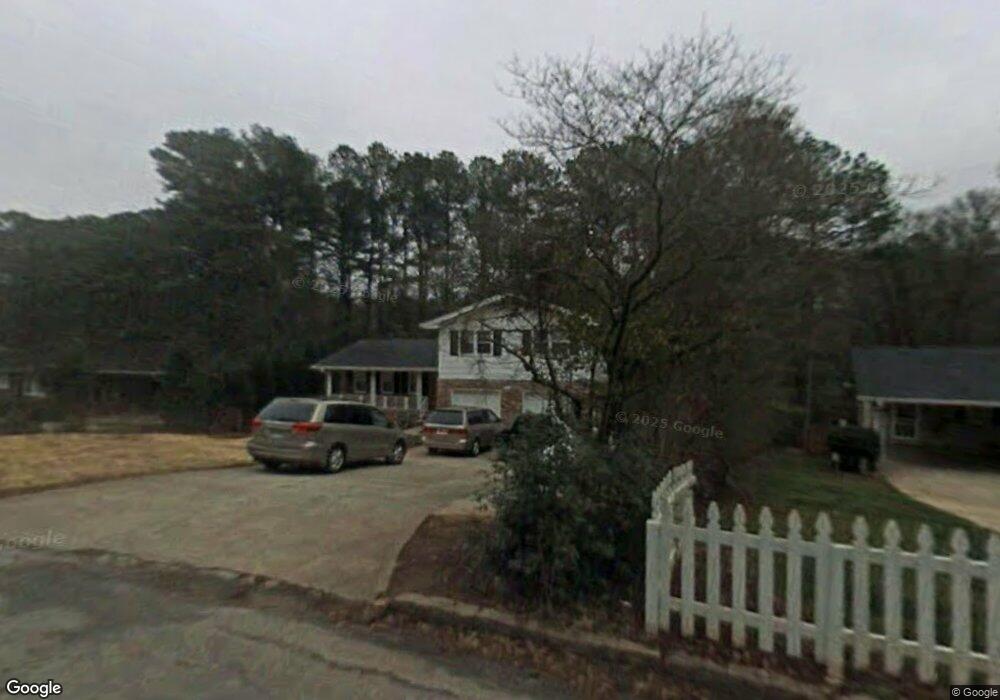
4177 Hideaway Dr Unit 4 Tucker, GA 30084
Estimated Value: $361,000 - $399,000
3
Beds
3
Baths
2,100
Sq Ft
$182/Sq Ft
Est. Value
About This Home
This home is located at 4177 Hideaway Dr Unit 4, Tucker, GA 30084 and is currently estimated at $382,992, approximately $182 per square foot. 4177 Hideaway Dr Unit 4 is a home located in DeKalb County with nearby schools including Idlewood Elementary School, Tucker Middle School, and Tucker High School.
Ownership History
Date
Name
Owned For
Owner Type
Purchase Details
Closed on
May 16, 2013
Sold by
Moalim Mohamed A
Bought by
Acharya Laxmi N and Dahal Nar K
Current Estimated Value
Home Financials for this Owner
Home Financials are based on the most recent Mortgage that was taken out on this home.
Original Mortgage
$116,000
Outstanding Balance
$81,695
Interest Rate
3.42%
Mortgage Type
New Conventional
Estimated Equity
$301,298
Purchase Details
Closed on
Aug 24, 1998
Sold by
Moalim Mohammed A
Bought by
Moalim Mohammed A and Moalim Zeinab
Home Financials for this Owner
Home Financials are based on the most recent Mortgage that was taken out on this home.
Original Mortgage
$108,500
Interest Rate
6.92%
Mortgage Type
New Conventional
Purchase Details
Closed on
Jul 22, 1997
Sold by
Lennox Susan C
Bought by
Moalim Mohamed A
Home Financials for this Owner
Home Financials are based on the most recent Mortgage that was taken out on this home.
Original Mortgage
$103,950
Interest Rate
7.5%
Mortgage Type
FHA
Create a Home Valuation Report for This Property
The Home Valuation Report is an in-depth analysis detailing your home's value as well as a comparison with similar homes in the area
Home Values in the Area
Average Home Value in this Area
Purchase History
| Date | Buyer | Sale Price | Title Company |
|---|---|---|---|
| Acharya Laxmi N | $145,000 | -- | |
| Moalim Mohammed A | -- | -- | |
| Moalim Mohamed A | $106,500 | -- |
Source: Public Records
Mortgage History
| Date | Status | Borrower | Loan Amount |
|---|---|---|---|
| Open | Acharya Laxmi N | $116,000 | |
| Previous Owner | Moalim Mohammed A | $108,500 | |
| Previous Owner | Moalim Mohamed A | $103,950 |
Source: Public Records
Tax History Compared to Growth
Tax History
| Year | Tax Paid | Tax Assessment Tax Assessment Total Assessment is a certain percentage of the fair market value that is determined by local assessors to be the total taxable value of land and additions on the property. | Land | Improvement |
|---|---|---|---|---|
| 2025 | $4,090 | $154,120 | $31,680 | $122,440 |
| 2024 | $3,590 | $130,800 | $31,680 | $99,120 |
| 2023 | $3,590 | $126,960 | $31,680 | $95,280 |
| 2022 | $2,840 | $102,960 | $25,760 | $77,200 |
| 2021 | $2,699 | $95,840 | $25,760 | $70,080 |
| 2020 | $2,209 | $75,200 | $14,160 | $61,040 |
| 2019 | $2,374 | $83,080 | $14,160 | $68,920 |
| 2018 | $2,182 | $82,800 | $17,160 | $65,640 |
| 2017 | $2,239 | $75,320 | $17,160 | $58,160 |
| 2016 | $2,009 | $66,880 | $17,160 | $49,720 |
| 2014 | $1,803 | $57,920 | $17,160 | $40,760 |
Source: Public Records
Map
Nearby Homes
- 4166 Idlevale Dr
- 1399 Sagewood Cir
- 1367 Wenlock Edge Cove
- 4201 Chatford Cove
- 4133 Idlewood Parc Ct
- 1394 Orchard Park Dr
- 4074 Idlevale Dr
- 4008 Orchard Hill Terrace
- 4000 Orchard Hill Terrace Unit 4000
- 1428 Orchard Park Dr Unit 1428
- 4028 Orchard Hill Terrace
- 1372 Idlewood Parc Crossing
- 1349 Orchard Park Dr
- 1343 Orchard Park Dr
- 4252 Parkview Ct
- 4245 Parkview Ct Unit H
- 4263 Parkview Ct
- 4171 Hideaway Dr
- 4189 Hideaway Dr
- 4165 Hideaway Dr Unit 4
- 4174 Hideaway Dr
- 4197 Hideaway Dr
- 4162 Hideaway Dr Unit 4
- 4157 Hideaway Dr
- 4192 Hideaway Dr
- 4177 Idlevale Dr Unit 4
- 1420 Sagewood Cir
- 4203 Hideaway Dr Unit 4
- 4151 Hideaway Dr
- 4152 Hideaway Dr
- 1426 Sagewood Cir
- 4211 Hideaway Dr
- 4184 Idlevale Dr
- 4202 Hideaway Dr Unit 4
- 4143 Hideaway Dr Unit 4
- 4165 Idlevale Dr
- 1406 Sagewood Cir