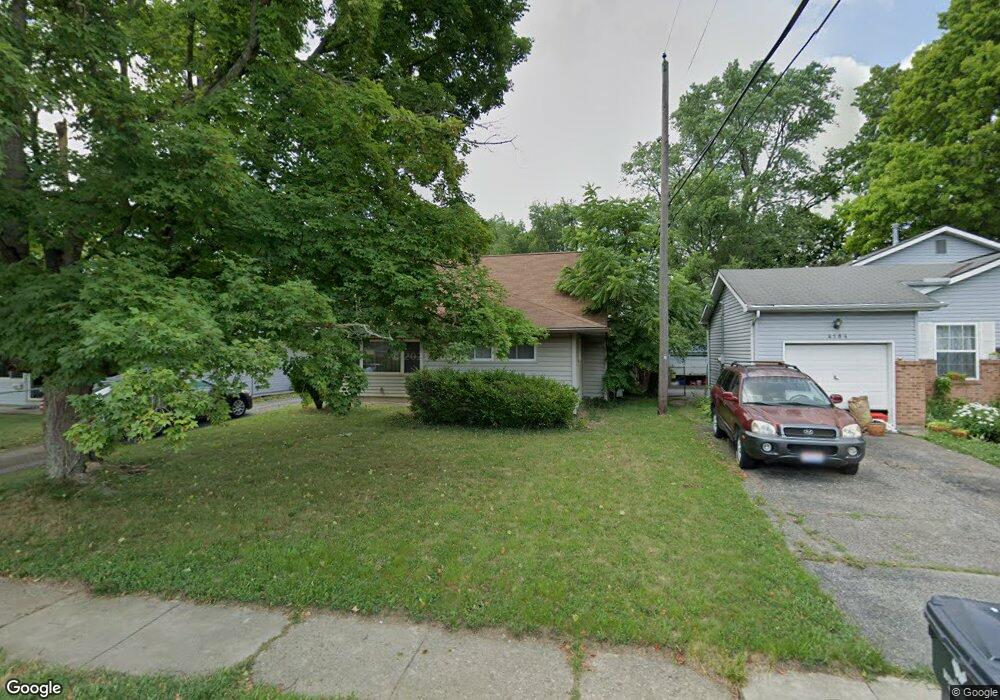
4178 Elbern Ave Columbus, OH 43213
Estimated Value: $193,242 - $225,000
5
Beds
1
Bath
1,375
Sq Ft
$151/Sq Ft
Est. Value
About This Home
This home is located at 4178 Elbern Ave, Columbus, OH 43213 and is currently estimated at $208,061, approximately $151 per square foot. 4178 Elbern Ave is a home located in Franklin County with nearby schools including Beechwood Elementary School, Etna Road Elementary School, and Rosemore Middle School.
Ownership History
Date
Name
Owned For
Owner Type
Purchase Details
Closed on
Oct 4, 2005
Sold by
Hud
Bought by
Johnson Ralston G
Current Estimated Value
Home Financials for this Owner
Home Financials are based on the most recent Mortgage that was taken out on this home.
Original Mortgage
$66,000
Interest Rate
5.8%
Mortgage Type
Balloon
Purchase Details
Closed on
Dec 13, 2004
Sold by
Evans William G and Mortgage Electronic Registrati
Bought by
Hud
Purchase Details
Closed on
Jun 30, 2000
Sold by
Butsko Rick and Estate Of Victoria D Murphy
Bought by
Evans William G and Evans Michelle E
Home Financials for this Owner
Home Financials are based on the most recent Mortgage that was taken out on this home.
Original Mortgage
$65,440
Interest Rate
8.64%
Mortgage Type
FHA
Purchase Details
Closed on
May 1, 1979
Create a Home Valuation Report for This Property
The Home Valuation Report is an in-depth analysis detailing your home's value as well as a comparison with similar homes in the area
Home Values in the Area
Average Home Value in this Area
Purchase History
| Date | Buyer | Sale Price | Title Company |
|---|---|---|---|
| Johnson Ralston G | $66,000 | Lakeside Ti | |
| Hud | $52,000 | Independent | |
| Evans William G | $66,000 | Chicago Title | |
| -- | $33,900 | -- |
Source: Public Records
Mortgage History
| Date | Status | Borrower | Loan Amount |
|---|---|---|---|
| Closed | Johnson Ralston G | $66,000 | |
| Previous Owner | Evans William G | $65,440 |
Source: Public Records
Tax History
| Year | Tax Paid | Tax Assessment Tax Assessment Total Assessment is a certain percentage of the fair market value that is determined by local assessors to be the total taxable value of land and additions on the property. | Land | Improvement |
|---|---|---|---|---|
| 2025 | $2,387 | $54,600 | $18,340 | $36,260 |
| 2024 | $2,387 | $54,600 | $18,340 | $36,260 |
| 2023 | $2,370 | $54,600 | $18,340 | $36,260 |
| 2022 | $1,825 | $31,960 | $5,640 | $26,320 |
| 2021 | $2,018 | $31,960 | $5,640 | $26,320 |
| 2020 | $1,710 | $31,960 | $5,640 | $26,320 |
| 2019 | $1,533 | $25,100 | $4,480 | $20,620 |
| 2018 | $1,535 | $25,100 | $4,480 | $20,620 |
| 2017 | $1,488 | $25,100 | $4,480 | $20,620 |
| 2016 | $1,495 | $22,890 | $4,970 | $17,920 |
| 2015 | $1,508 | $22,890 | $4,970 | $17,920 |
| 2014 | $1,508 | $22,890 | $4,970 | $17,920 |
| 2013 | $798 | $25,445 | $5,530 | $19,915 |
Source: Public Records
Map
Nearby Homes
- 4148 Elbern Ave
- 4117 Elbern Ave
- 4212 Seigman Ave
- 4105 Elbern Ave
- 225 Santa Maria Ln
- 491 Westphal Ave
- 4481 Chandler Dr
- 658 S Yearling Rd
- 4517 Saint Rita Ln
- 695 Erickson Ave
- 3840 Elbern Ave
- 4174 Wright Park
- 3857 Doney St
- 745 Pierce Ave
- 3814 Elbern Ave
- 320 Collingwood Ave
- 798 S Yearling Rd
- 706 Ross Rd
- 413 Shell Ct E Unit K413
- 4308 E Main St Unit 1
- 4172 Elbern Ave
- 4184 Elbern Ave
- 4190 Elbern Ave
- 4166 Elbern Ave
- 4185 Chandler Dr
- 4179 Chandler Dr
- 4191 Chandler Dr
- 4160 Elbern Ave
- 4173 Chandler Dr
- 4197 Chandler Dr
- 4177 Elbern Ave
- 4171 Elbern Ave
- 4183 Elbern Ave
- 4154 Elbern Ave
- 4202 Elbern Ave
- 4157 Chandler Dr
- 4203 Chandler Dr
- 4189 Elbern Ave
- 4165 Elbern Ave
- 4159 Elbern Ave
Your Personal Tour Guide
Ask me questions while you tour the home.