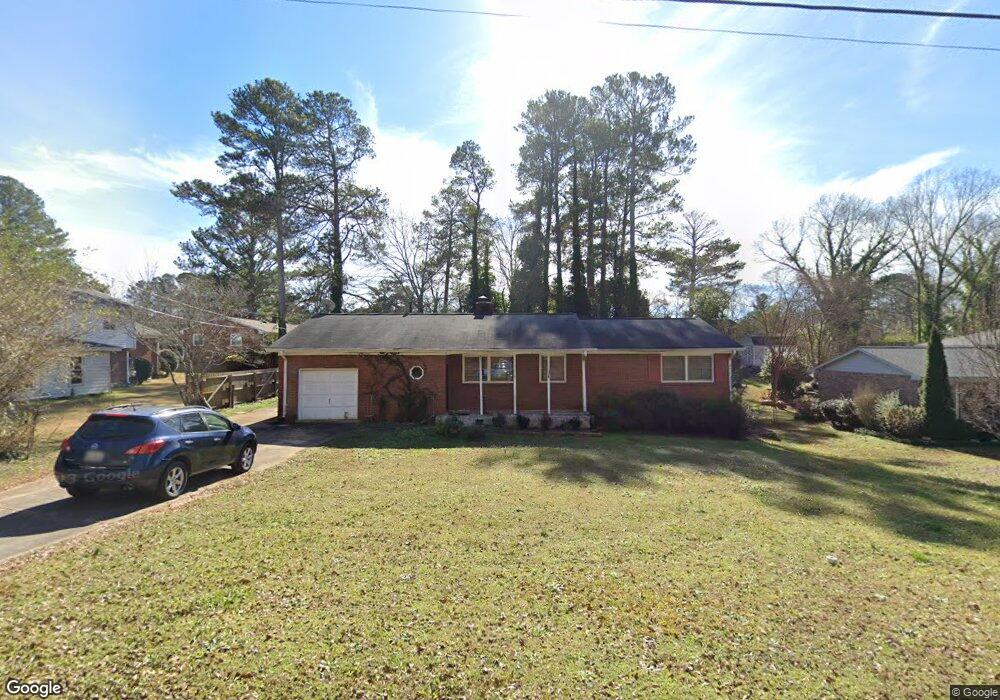
4179 Rue Dartagnan Stone Mountain, GA 30083
Estimated Value: $260,591 - $304,000
3
Beds
2
Baths
1,839
Sq Ft
$155/Sq Ft
Est. Value
About This Home
This home is located at 4179 Rue Dartagnan, Stone Mountain, GA 30083 and is currently estimated at $284,148, approximately $154 per square foot. 4179 Rue Dartagnan is a home located in DeKalb County with nearby schools including Allgood Elementary School, Freedom Middle School, and Clarkston High School.
Ownership History
Date
Name
Owned For
Owner Type
Purchase Details
Closed on
Aug 15, 2018
Sold by
Abdella Feiruz
Bought by
Medhane Kibra
Current Estimated Value
Purchase Details
Closed on
Sep 10, 2010
Sold by
Medhane Kibra
Bought by
Abdella Feiruz
Purchase Details
Closed on
Aug 10, 2010
Sold by
Federal Natl Mtg Assn Fnma
Bought by
Medhane Kibra
Purchase Details
Closed on
Jul 6, 2010
Sold by
Onewest Bk Fsb
Bought by
Federal Natl Mtg Assn Fnma
Purchase Details
Closed on
Oct 13, 2006
Sold by
Ogilvie Delrose
Bought by
Ogilvie Delrose and Ogilvie Sharika E
Home Financials for this Owner
Home Financials are based on the most recent Mortgage that was taken out on this home.
Original Mortgage
$121,500
Interest Rate
6.48%
Mortgage Type
New Conventional
Purchase Details
Closed on
Sep 25, 2006
Sold by
Townsend Luanne
Bought by
Ogilvie Delrose
Home Financials for this Owner
Home Financials are based on the most recent Mortgage that was taken out on this home.
Original Mortgage
$121,500
Interest Rate
6.48%
Mortgage Type
New Conventional
Create a Home Valuation Report for This Property
The Home Valuation Report is an in-depth analysis detailing your home's value as well as a comparison with similar homes in the area
Home Values in the Area
Average Home Value in this Area
Purchase History
| Date | Buyer | Sale Price | Title Company |
|---|---|---|---|
| Medhane Kibra | -- | -- | |
| Abdella Feiruz | -- | -- | |
| Medhane Kibra | -- | -- | |
| Federal Natl Mtg Assn Fnma | -- | -- | |
| Ogilvie Delrose | $121,500 | -- | |
| Ogilvie Delrose | $135,000 | -- |
Source: Public Records
Mortgage History
| Date | Status | Borrower | Loan Amount |
|---|---|---|---|
| Previous Owner | Ogilvie Delrose | $121,500 |
Source: Public Records
Tax History Compared to Growth
Tax History
| Year | Tax Paid | Tax Assessment Tax Assessment Total Assessment is a certain percentage of the fair market value that is determined by local assessors to be the total taxable value of land and additions on the property. | Land | Improvement |
|---|---|---|---|---|
| 2025 | $2,770 | $101,840 | $18,331 | $83,509 |
| 2024 | $2,853 | $103,440 | $18,160 | $85,280 |
| 2023 | $2,853 | $102,560 | $18,160 | $84,400 |
| 2022 | $2,283 | $82,040 | $15,000 | $67,040 |
| 2021 | $1,810 | $61,560 | $8,000 | $53,560 |
| 2020 | $1,807 | $61,240 | $8,000 | $53,240 |
| 2019 | $1,703 | $57,240 | $8,000 | $49,240 |
| 2018 | $1,232 | $52,120 | $10,240 | $41,880 |
| 2017 | $1,408 | $42,760 | $10,240 | $32,520 |
| 2016 | $1,158 | $35,000 | $10,240 | $24,760 |
| 2014 | $586 | $18,200 | $10,240 | $7,960 |
Source: Public Records
Map
Nearby Homes
- 494 Rue Montaigne
- 4210 Rockbridge Rd
- 4328 Rockbridge Rd
- 550 S Rays (9 74 Acres) Rd
- 539 Rue Montaigne
- 550 S Rays (8 6 Acres) Rd
- 550 S Rays Rd
- 570 Kenridge Cir
- 579 Kenridge Cir
- 440 Sheppard Xing Ct
- 450 S Susan Creek Dr
- 4238 Rue Saint Michel
- 4166 Rue Saint Michel
- 4250 Village Square Ln
- 488 Barclay Ct
- 534 Woodcrest Manor Dr
- 4128 Indian Manor Dr
- 573 Allgood Rd
- 573 Hambrick Square
- 3943 Dunaire Dr
- 4173 Rue Dartagnan
- 455 Rays Rd
- 465 S Rays Rd
- 455 S Rays Rd
- 4165 Rue Dartagnan
- 4180 Rue Saint Germain
- 4172 Rue Saint Germain
- 4178 Rue Dartagnan
- 4188 Rue Saint Germain Unit 2
- 4172 Rue Dartagnan
- 4159 Rue Dartagnan
- 4166 Rue Saint Germain
- 4164 Rue Dartagnan
- 4203 Rue Dartagnan Unit 2
- 466 S Rays Rd
- 4160 Rue Saint Germain Unit 1
- 433 S Rays Rd Unit II
- 4153 Rue Dartagnan
- 4158 Rue Dartagnan
- 4204 Rue Dartagnan