Estimated Value: $444,000 - $542,000
5
Beds
3
Baths
1,800
Sq Ft
$270/Sq Ft
Est. Value
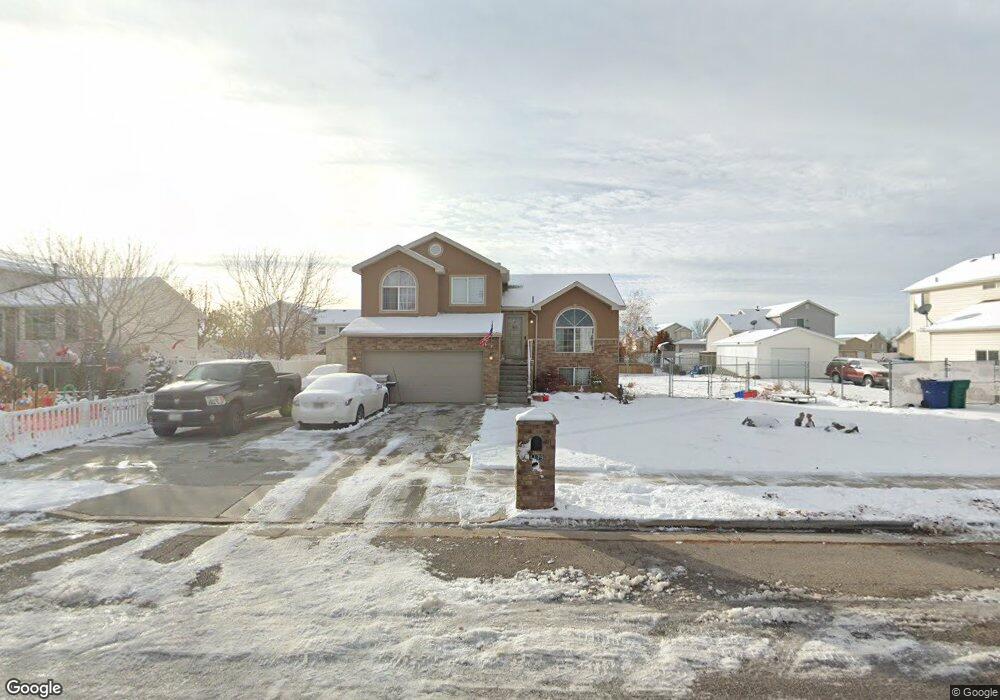
About This Home
This home is located at 4179 W 5850 S, Roy, UT 84067 and is currently estimated at $485,655, approximately $269 per square foot. 4179 W 5850 S is a home located in Weber County with nearby schools including Freedom School, Roy Junior High School, and Roy High School.
Ownership History
Date
Name
Owned For
Owner Type
Purchase Details
Closed on
May 15, 2023
Sold by
Webb James F
Bought by
Rigby Home Buyers Llc
Current Estimated Value
Purchase Details
Closed on
Dec 4, 2003
Sold by
Great American Homes Inc
Bought by
Webb James F and Webb Jacki A
Home Financials for this Owner
Home Financials are based on the most recent Mortgage that was taken out on this home.
Original Mortgage
$156,785
Interest Rate
6.04%
Mortgage Type
FHA
Create a Home Valuation Report for This Property
The Home Valuation Report is an in-depth analysis detailing your home's value as well as a comparison with similar homes in the area
Home Values in the Area
Average Home Value in this Area
Purchase History
| Date | Buyer | Sale Price | Title Company |
|---|---|---|---|
| Rigby Home Buyers Llc | -- | Real Advantage Title | |
| Webb James F | -- | Bonneville Title |
Source: Public Records
Mortgage History
| Date | Status | Borrower | Loan Amount |
|---|---|---|---|
| Previous Owner | Webb James F | $156,785 |
Source: Public Records
Tax History Compared to Growth
Tax History
| Year | Tax Paid | Tax Assessment Tax Assessment Total Assessment is a certain percentage of the fair market value that is determined by local assessors to be the total taxable value of land and additions on the property. | Land | Improvement |
|---|---|---|---|---|
| 2025 | $2,835 | $453,275 | $155,015 | $298,260 |
| 2024 | $2,769 | $245,299 | $85,258 | $160,041 |
| 2023 | $2,706 | $240,350 | $85,194 | $155,156 |
| 2022 | $2,528 | $229,350 | $68,751 | $160,599 |
| 2021 | $2,179 | $326,000 | $85,012 | $240,988 |
| 2020 | $2,125 | $293,000 | $85,012 | $207,988 |
| 2019 | $2,037 | $264,000 | $55,035 | $208,965 |
| 2018 | $1,877 | $228,000 | $55,035 | $172,965 |
| 2017 | $1,784 | $203,000 | $55,035 | $147,965 |
| 2016 | $1,717 | $105,015 | $30,199 | $74,816 |
| 2015 | $1,542 | $95,980 | $30,199 | $65,781 |
| 2014 | $1,506 | $92,495 | $30,199 | $62,296 |
Source: Public Records
Map
Nearby Homes
- 4169 W 5850 S
- 4187 W 5850 S
- 4186 W 5900 S
- 4172 W 5900 S
- 4202 W 5900 S
- 4161 W 5850 S
- 4188 W 5850 S
- 4174 W 5850 S
- 4205 W 5850 S
- 4205 W 5850 S Unit 9
- 4160 W 5900 S
- 4214 W 5900 S
- 4151 W 5850 S
- 4204 W 5850 S
- 4204 W 5850 S Unit 8
- 4156 W 5900 S
- 5833 S 4175 W
- 4189 W 5900 S
- 4227 W 5850 S
- 4227 W 5850 S Unit 10