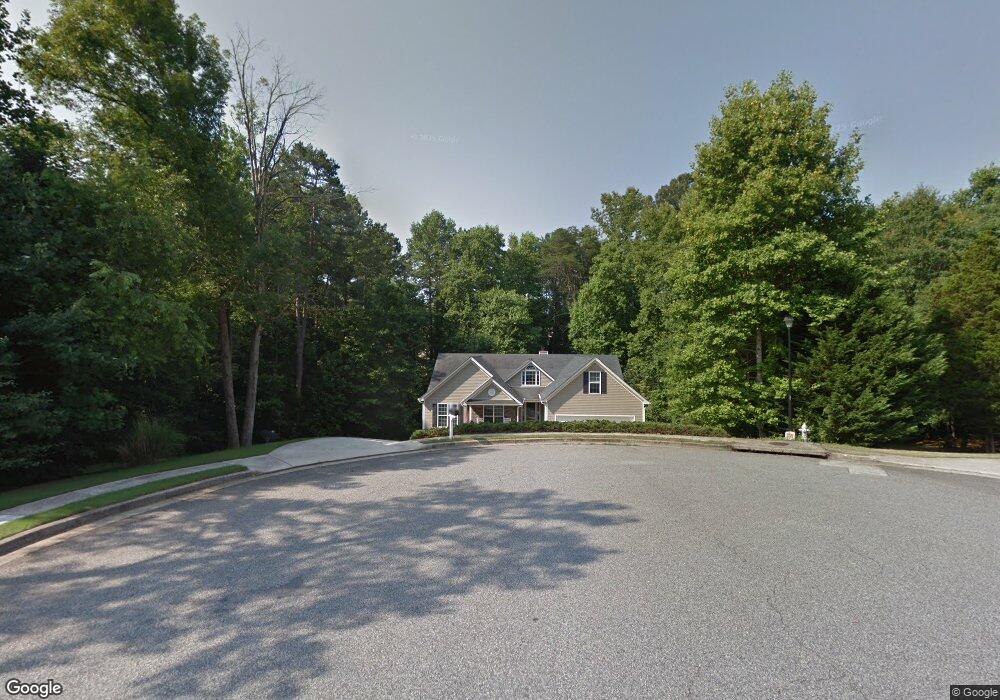
4179 Wyndham Park Way Unit 2 Buford, GA 30519
Estimated Value: $438,000 - $458,622
4
Beds
2
Baths
2,478
Sq Ft
$182/Sq Ft
Est. Value
About This Home
This home is located at 4179 Wyndham Park Way Unit 2, Buford, GA 30519 and is currently estimated at $450,656, approximately $181 per square foot. 4179 Wyndham Park Way Unit 2 is a home located in Gwinnett County with nearby schools including Ivy Creek Elementary School, Glenn C. Jones Middle School, and Celebration Academy.
Ownership History
Date
Name
Owned For
Owner Type
Purchase Details
Closed on
Aug 18, 2022
Sold by
Sayer Trevor A
Bought by
Sayer Trevor and Trevor & Arelia Sayer Rev Liv Tr
Current Estimated Value
Purchase Details
Closed on
Sep 1, 2006
Sold by
Hamilton Homes Llc
Bought by
Hayes Paul W and Hayes Charisse A
Home Financials for this Owner
Home Financials are based on the most recent Mortgage that was taken out on this home.
Original Mortgage
$142,500
Interest Rate
6.67%
Mortgage Type
New Conventional
Purchase Details
Closed on
Mar 5, 2004
Sold by
Leecrest Homes Inc
Bought by
Hamilton Homes Llc
Home Financials for this Owner
Home Financials are based on the most recent Mortgage that was taken out on this home.
Original Mortgage
$151,920
Interest Rate
5.68%
Create a Home Valuation Report for This Property
The Home Valuation Report is an in-depth analysis detailing your home's value as well as a comparison with similar homes in the area
Home Values in the Area
Average Home Value in this Area
Purchase History
| Date | Buyer | Sale Price | Title Company |
|---|---|---|---|
| Sayer Trevor | -- | -- | |
| Hayes Paul W | $214,900 | -- | |
| Hamilton Homes Llc | $46,000 | -- |
Source: Public Records
Mortgage History
| Date | Status | Borrower | Loan Amount |
|---|---|---|---|
| Previous Owner | Hayes Paul W | $142,500 | |
| Previous Owner | Hamilton Homes Llc | $151,920 |
Source: Public Records
Tax History Compared to Growth
Tax History
| Year | Tax Paid | Tax Assessment Tax Assessment Total Assessment is a certain percentage of the fair market value that is determined by local assessors to be the total taxable value of land and additions on the property. | Land | Improvement |
|---|---|---|---|---|
| 2025 | $1,360 | $197,200 | $30,400 | $166,800 |
| 2024 | $1,383 | $197,200 | $30,400 | $166,800 |
| 2023 | $1,383 | $209,560 | $30,400 | $179,160 |
| 2022 | $1,344 | $198,400 | $27,200 | $171,200 |
| 2021 | $1,329 | $150,760 | $22,360 | $128,400 |
| 2020 | $1,327 | $143,760 | $20,720 | $123,040 |
| 2019 | $4,045 | $131,800 | $17,920 | $113,880 |
| 2018 | $3,772 | $118,880 | $17,920 | $100,960 |
| 2016 | $3,336 | $97,760 | $14,400 | $83,360 |
| 2015 | $3,203 | $90,600 | $12,000 | $78,600 |
| 2014 | $3,229 | $91,320 | $12,000 | $79,320 |
Source: Public Records
Map
Nearby Homes
- 4162 Wyndham Ridge Ct Unit 3
- 2726 Talley Ln
- 2740 Talley Ln
- 2724 Talley Ln
- 3475 Duncan Bridge Dr Unit 2
- 4292 Sardis Church Rd
- 4602 Shay Terrace
- 2590 Hamilton Parc Ln
- 2485 Hamilton Parc Ln
- 2415 Hamilton Parc Ln
- 4785 Nolans Ridge
- 4728 Moon Hollow Ct
- 2200 Spring Sound Ln
- 4732 Moon Chase Dr
- 4082 Adler Cir Unit 35
- 4082 Adler Cir
- 2171 Spring Sound Ln
- 3941 Adler Cir
- 2424 Pinnae Place
- 4174 Wyndham Park Way
- 4189 Wyndham Park Way
- 3975 Lenox Park Dr
- 3985 Lenox Park Dr Unit 2
- 4166 Wyndham Pointe Ct
- 4176 Wyndham Pointe Ct Unit 3
- 4005 Lenox Park Dr Unit 2
- 2680 Wyndham Park Dr NE
- 0 Wyndham Park Way Unit 7400542
- 3965 Lenox Park Dr
- 4194 Wyndham Park Way
- 4186 Wyndham Pointe Ct
- 0 Wyndham Park Dr NE Unit 7438395
- 0 Wyndham Park Dr NE Unit 7285447
- 0 Wyndham Park Dr NE Unit 7197110
- 0 Wyndham Park Dr NE Unit 3229189
- 0 Wyndham Park Dr NE Unit 8363986
- 0 Wyndham Park Dr NE Unit 8923810
- 0 Wyndham Park Dr NE Unit 8961957
- 0 Wyndham Park Dr NE Unit 8965741