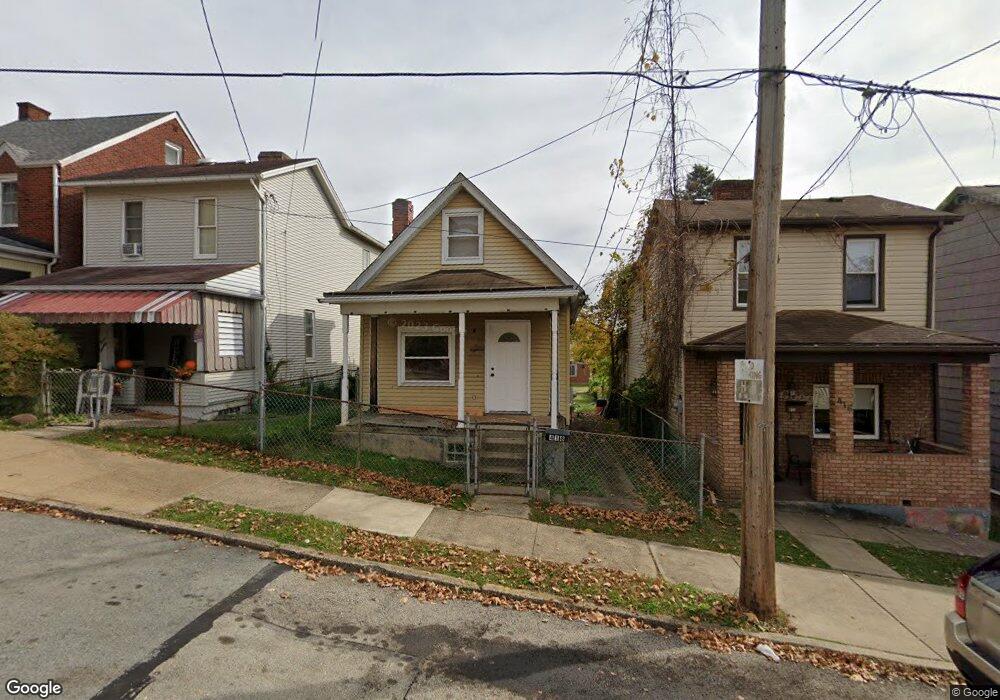
418 26th St McKeesport, PA 15132
Estimated Value: $43,000 - $86,000
2
Beds
1
Bath
828
Sq Ft
$80/Sq Ft
Est. Value
About This Home
This home is located at 418 26th St, McKeesport, PA 15132 and is currently estimated at $66,200, approximately $79 per square foot. 418 26th St is a home located in Allegheny County with nearby schools including Mckeesport Area Senior High School, Young Scholars of Greater Allegheny Charter School, and Propel Schools - McKeesport.
Ownership History
Date
Name
Owned For
Owner Type
Purchase Details
Closed on
Apr 28, 2025
Sold by
Bryce Roger E
Bought by
Bamgbose Adetola Zainab
Current Estimated Value
Purchase Details
Closed on
Aug 20, 2020
Sold by
Bryce Roger E and Cosgrove Alyssa M
Bought by
Bryce Roger E
Purchase Details
Closed on
Nov 14, 2018
Sold by
Raine Dustin
Bought by
Bryce Roger E and Cosgrove Alyssa M
Purchase Details
Closed on
Jun 14, 2017
Sold by
Gazdich Theresa L and Gazdich Mary Jean
Bought by
Raine Dustin
Purchase Details
Closed on
Aug 27, 2001
Sold by
Hud
Bought by
Ross Charles D and Ross Theresa L
Purchase Details
Closed on
Oct 30, 2000
Sold by
Federal National Mortgage Association
Bought by
Hud
Purchase Details
Closed on
Jul 12, 2000
Sold by
Mycka Claude J and Mycka Mary M
Bought by
Federal National Mortgage Association
Create a Home Valuation Report for This Property
The Home Valuation Report is an in-depth analysis detailing your home's value as well as a comparison with similar homes in the area
Home Values in the Area
Average Home Value in this Area
Purchase History
| Date | Buyer | Sale Price | Title Company |
|---|---|---|---|
| Bamgbose Adetola Zainab | $20,000 | -- | |
| Bamgbose Adetola Zainab | $20,000 | -- | |
| Bryce Roger E | $2,500 | Attorney | |
| Bryce Roger E | -- | None Available | |
| Raine Dustin | -- | None Available | |
| Ross Charles D | $4,750 | -- | |
| Hud | -- | -- | |
| Federal National Mortgage Association | $3,106 | -- |
Source: Public Records
Tax History Compared to Growth
Tax History
| Year | Tax Paid | Tax Assessment Tax Assessment Total Assessment is a certain percentage of the fair market value that is determined by local assessors to be the total taxable value of land and additions on the property. | Land | Improvement |
|---|---|---|---|---|
| 2025 | $1,483 | $32,100 | $7,500 | $24,600 |
| 2024 | $1,483 | $32,100 | $7,500 | $24,600 |
| 2023 | $1,483 | $32,100 | $7,500 | $24,600 |
| 2022 | $1,483 | $32,100 | $7,500 | $24,600 |
| 2021 | $152 | $32,100 | $7,500 | $24,600 |
| 2020 | $1,457 | $32,100 | $7,500 | $24,600 |
| 2019 | $978 | $32,100 | $7,500 | $24,600 |
| 2018 | $152 | $32,100 | $7,500 | $24,600 |
| 2017 | $890 | $32,100 | $7,500 | $24,600 |
| 2016 | $152 | $32,100 | $7,500 | $24,600 |
| 2015 | $152 | $32,100 | $7,500 | $24,600 |
| 2014 | $656 | $32,100 | $7,500 | $24,600 |
Source: Public Records
Map
Nearby Homes
- 322 27th St
- 310 27th St
- 314 29th St
- 2805 Riverview St
- 1913 Evans Ave
- 0 Center St Unit 1680990
- 1405/1407 Walnut St
- 0 Center St Unit 1680991
- 0 Center St Unit 1680988
- 0 Center St Unit 1680987
- 0 Center St Unit 1680974
- 1819 Scott St
- 2810 Jenny Lind St
- 2812 Jenny Lind St
- 419 31st St
- 1813 Duquesne Ave
- 1805 Duquesne Ave
- 1714 Scott St
- 1801 Eaton St
- 3021 Myer Blvd