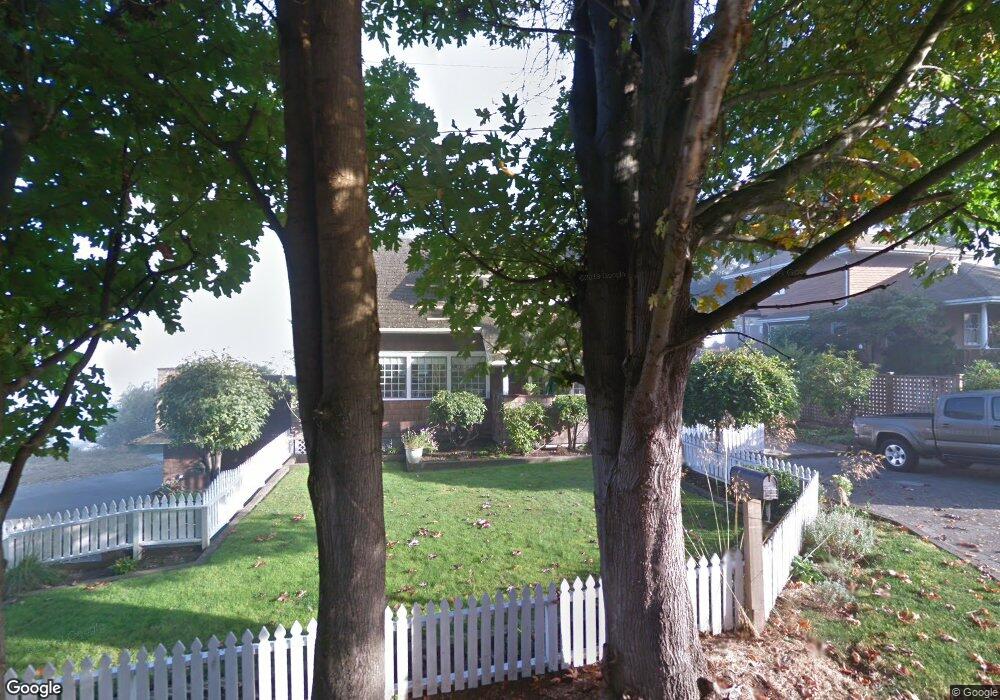
418 2nd St Anacortes, WA 98221
Estimated Value: $1,242,076 - $1,686,000
4
Beds
3
Baths
3,520
Sq Ft
$401/Sq Ft
Est. Value
About This Home
This home is located at 418 2nd St, Anacortes, WA 98221 and is currently estimated at $1,411,269, approximately $400 per square foot. 418 2nd St is a home located in Skagit County with nearby schools including Anacortes High School, San Juan Montessori School, and Secret Harbor.
Ownership History
Date
Name
Owned For
Owner Type
Purchase Details
Closed on
Dec 9, 2013
Sold by
Shain Barry L
Bought by
Shain J Renee
Current Estimated Value
Purchase Details
Closed on
Jan 14, 2010
Sold by
Rbc Bank Usa
Bought by
Shain Barry L and Shain Renee J
Home Financials for this Owner
Home Financials are based on the most recent Mortgage that was taken out on this home.
Original Mortgage
$352,400
Outstanding Balance
$229,973
Interest Rate
4.91%
Mortgage Type
New Conventional
Estimated Equity
$1,181,296
Purchase Details
Closed on
Sep 26, 2008
Sold by
Kirkpatrick Kevin and Mortgage Electronic Registrati
Bought by
Rbc Bank Usa
Create a Home Valuation Report for This Property
The Home Valuation Report is an in-depth analysis detailing your home's value as well as a comparison with similar homes in the area
Purchase History
| Date | Buyer | Sale Price | Title Company |
|---|---|---|---|
| Shain J Renee | -- | Accommodation | |
| Shain Barry L | $440,780 | Land Title & Escrow | |
| Rbc Bank Usa | $566,374 | Chicago Title Co |
Source: Public Records
Mortgage History
| Date | Status | Borrower | Loan Amount |
|---|---|---|---|
| Open | Shain Barry L | $352,400 |
Source: Public Records
Tax History Compared to Growth
Tax History
| Year | Tax Paid | Tax Assessment Tax Assessment Total Assessment is a certain percentage of the fair market value that is determined by local assessors to be the total taxable value of land and additions on the property. | Land | Improvement |
|---|---|---|---|---|
| 2025 | $9,504 | $1,329,600 | $663,400 | $666,200 |
| 2024 | $9,121 | $1,258,600 | $641,300 | $617,300 |
| 2023 | $9,121 | $1,209,700 | $537,600 | $672,100 |
| 2022 | $7,718 | $1,222,500 | $550,400 | $672,100 |
| 2021 | $7,442 | $902,900 | $471,800 | $431,100 |
| 2020 | $7,596 | $807,100 | $0 | $0 |
| 2019 | $7,310 | $807,100 | $0 | $0 |
| 2018 | $6,603 | $774,600 | $0 | $0 |
| 2017 | $5,779 | $630,000 | $0 | $0 |
| 2016 | $5,256 | $606,900 | $305,300 | $301,600 |
| 2015 | $5,161 | $530,700 | $270,800 | $259,900 |
| 2013 | $4,917 | $510,700 | $0 | $0 |
Source: Public Records
Map
Nearby Homes
- 520 O Ave
- 1202 5th St
- 1418 6th St Unit 1418
- 1502 5th St
- 1520 1518 10th St
- 1506 12th St
- 1102 17th St
- 0 XX 18th St
- 911 - 919 Commercial Ave
- 4011 Commercial Ave
- 1808 Commercial Ave
- 0 17th St Unit NWM2414205
- 2907 17th St
- 5447 S Shore Dr
- 2904 17th St
- 7782 Cypress Way
- 902 24th St
- 7604 Holiday Blvd
- 7541 Holiday Blvd
- 7408 Holiday Blvd