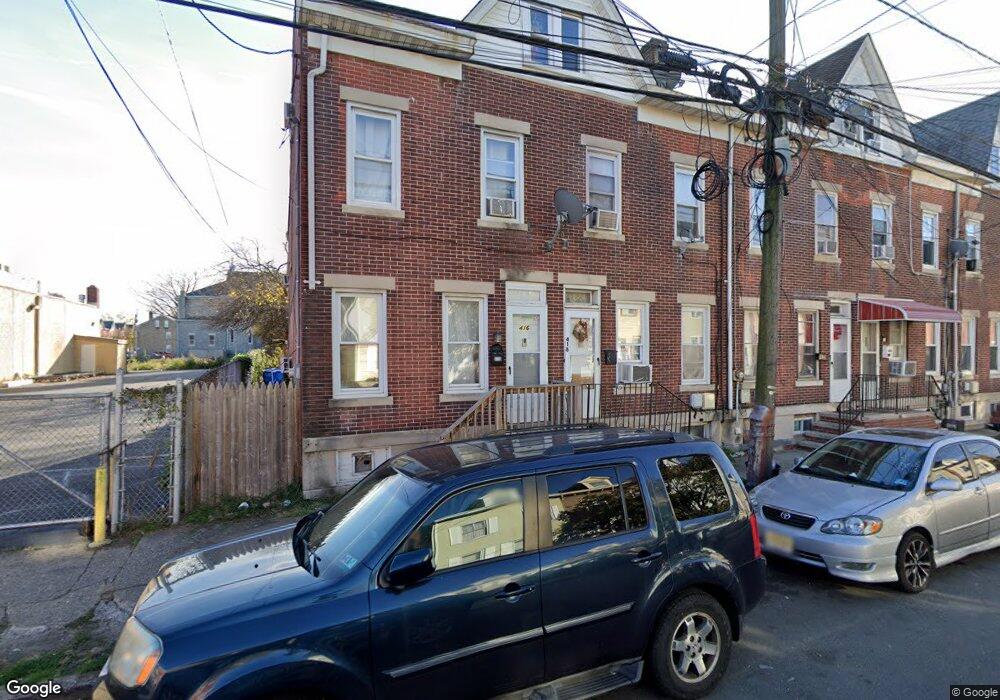
418 Beatty St Trenton, NJ 08611
Chambersburg NeighborhoodEstimated Value: $101,000 - $229,000
--
Bed
--
Bath
1,616
Sq Ft
$111/Sq Ft
Est. Value
About This Home
This home is located at 418 Beatty St, Trenton, NJ 08611 and is currently estimated at $179,333, approximately $110 per square foot. 418 Beatty St is a home located in Mercer County with nearby schools including Harrison Elementary School, Parker Elementary School, and Dr. Crosby Copeland Elementary School.
Ownership History
Date
Name
Owned For
Owner Type
Purchase Details
Closed on
Sep 21, 2021
Sold by
Group Nj Llc
Bought by
Jrm Capital Partners Llc
Current Estimated Value
Purchase Details
Closed on
Jul 21, 2021
Sold by
Group Nj Llc
Bought by
Jrm Capital Partners Llc
Home Financials for this Owner
Home Financials are based on the most recent Mortgage that was taken out on this home.
Original Mortgage
$385,000
Interest Rate
2.7%
Mortgage Type
Purchase Money Mortgage
Purchase Details
Closed on
Jan 4, 2012
Sold by
Shapira Yoel
Bought by
Jnh Funding Corp
Purchase Details
Closed on
Dec 5, 2008
Purchase Details
Closed on
Sep 18, 2008
Sold by
Hatrak Edward D
Bought by
Raintree Hldgs Llc
Create a Home Valuation Report for This Property
The Home Valuation Report is an in-depth analysis detailing your home's value as well as a comparison with similar homes in the area
Home Values in the Area
Average Home Value in this Area
Purchase History
| Date | Buyer | Sale Price | Title Company |
|---|---|---|---|
| Jrm Capital Partners Llc | -- | None Listed On Document | |
| Jrm Capital Partners Llc | -- | None Listed On Document | |
| Group Nj Llc | $65,000 | Dekel Abstract Llc | |
| Jnh Funding Corp | $274 | None Available | |
| -- | $47,000 | -- | |
| Raintree Hldgs Llc | $44,480 | -- |
Source: Public Records
Mortgage History
| Date | Status | Borrower | Loan Amount |
|---|---|---|---|
| Previous Owner | Group Nj Llc | $385,000 |
Source: Public Records
Tax History Compared to Growth
Tax History
| Year | Tax Paid | Tax Assessment Tax Assessment Total Assessment is a certain percentage of the fair market value that is determined by local assessors to be the total taxable value of land and additions on the property. | Land | Improvement |
|---|---|---|---|---|
| 2025 | $3,121 | $53,800 | $6,800 | $47,000 |
| 2024 | $2,995 | $53,800 | $6,800 | $47,000 |
| 2023 | $2,995 | $53,800 | $6,800 | $47,000 |
| 2022 | $2,936 | $53,800 | $6,800 | $47,000 |
| 2021 | $2,988 | $53,800 | $6,800 | $47,000 |
| 2020 | $2,978 | $53,800 | $6,800 | $47,000 |
| 2019 | $2,930 | $53,800 | $6,800 | $47,000 |
| 2018 | $2,805 | $53,800 | $6,800 | $47,000 |
| 2017 | $2,666 | $53,800 | $6,800 | $47,000 |
| 2016 | $2,796 | $48,600 | $14,900 | $33,700 |
| 2015 | $2,786 | $48,600 | $14,900 | $33,700 |
| 2014 | $2,773 | $48,600 | $14,900 | $33,700 |
Source: Public Records
Map
Nearby Homes