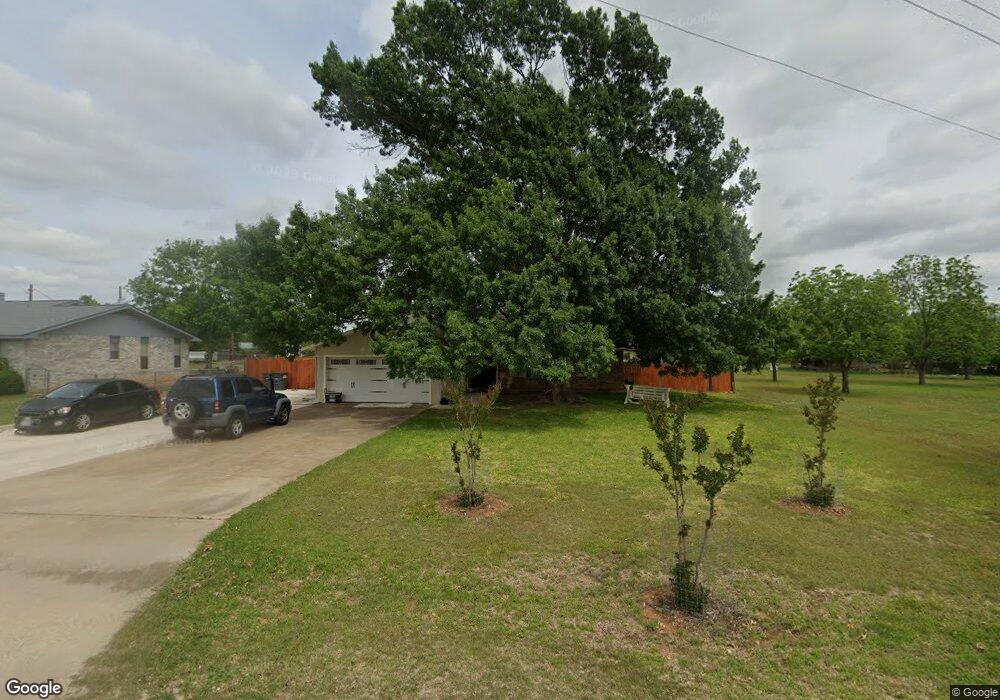
418 Bob Moritz Dr Fredericksburg, TX 78624
Estimated Value: $451,828 - $648,000
3
Beds
2
Baths
2,644
Sq Ft
$207/Sq Ft
Est. Value
About This Home
This home is located at 418 Bob Moritz Dr, Fredericksburg, TX 78624 and is currently estimated at $547,457, approximately $207 per square foot. 418 Bob Moritz Dr is a home located in Gillespie County with nearby schools including Fredericksburg High School, Ambleside School of Fredericksburg, and St. Mary's Catholic School.
Ownership History
Date
Name
Owned For
Owner Type
Purchase Details
Closed on
Sep 1, 2021
Sold by
Ronald A Stotz Md Profit Sharing Plan and Stotz Ronald D
Bought by
Aguilar Jose A and Herrera Brenda Y
Current Estimated Value
Purchase Details
Closed on
Jan 5, 2017
Sold by
Stotz Ronald A
Bought by
Stotz Ronald and Stotz Ronald D
Home Financials for this Owner
Home Financials are based on the most recent Mortgage that was taken out on this home.
Original Mortgage
$251,250
Interest Rate
4.08%
Mortgage Type
Credit Line Revolving
Purchase Details
Closed on
Sep 18, 2012
Sold by
Lynn Gerald David and Lynn Teresa
Bought by
Stotz Ronald and Stotz Ollie Belle
Home Financials for this Owner
Home Financials are based on the most recent Mortgage that was taken out on this home.
Original Mortgage
$215,000
Interest Rate
3.62%
Mortgage Type
Purchase Money Mortgage
Create a Home Valuation Report for This Property
The Home Valuation Report is an in-depth analysis detailing your home's value as well as a comparison with similar homes in the area
Home Values in the Area
Average Home Value in this Area
Purchase History
| Date | Buyer | Sale Price | Title Company |
|---|---|---|---|
| Aguilar Jose A | -- | None Listed On Document | |
| Stotz Ronald | -- | None Available | |
| Stotz Ronald | -- | None Available |
Source: Public Records
Mortgage History
| Date | Status | Borrower | Loan Amount |
|---|---|---|---|
| Previous Owner | Stotz Ronald | $251,250 | |
| Previous Owner | Stotz Ronald | $215,000 |
Source: Public Records
Tax History Compared to Growth
Tax History
| Year | Tax Paid | Tax Assessment Tax Assessment Total Assessment is a certain percentage of the fair market value that is determined by local assessors to be the total taxable value of land and additions on the property. | Land | Improvement |
|---|---|---|---|---|
| 2025 | $4,124 | $394,060 | $72,060 | $322,000 |
| 2024 | $4,124 | $405,830 | $72,060 | $333,770 |
| 2023 | $4,301 | $405,830 | $72,060 | $333,770 |
| 2022 | $4,762 | $366,680 | $54,170 | $312,510 |
| 2021 | $4,575 | $312,040 | $37,650 | $274,390 |
| 2020 | $4,111 | $274,950 | $33,060 | $241,890 |
| 2019 | $4,293 | $274,950 | $33,060 | $241,890 |
| 2018 | $3,762 | $242,170 | $33,060 | $209,110 |
| 2017 | $3,704 | $233,220 | $33,060 | $200,160 |
| 2016 | $3,504 | $220,600 | $32,140 | $188,460 |
| 2015 | -- | $202,170 | $20,660 | $181,510 |
| 2014 | -- | $202,170 | $20,660 | $181,510 |
Source: Public Records
Map
Nearby Homes
- 139 Armory Rd
- Lts GE345 et el Shorty Crenwelge Dr
- 0 Shorty Crenwelge Rd Unit GE345 etel 120250
- 219 Armory Rd
- 417 Royal Oaks Loop
- 215 Catholic Cemetery Rd Unit 2
- 219 Catholic Cemetery Rd Unit 3
- 461 Shortys Ln
- 214 Woodcrest St
- 214 Woodcrest St Unit 8
- 218 Woodcrest St Unit 7
- TBD E Us Hwy 290 Unit 1
- TBD E Us Hwy 290 Unit 4-7
- TBD E Us Hwy 290 Unit 5
- TBD E Us Hwy 290 Unit 3
- TBD E Us Hwy 290 Unit 4
- TBD E Us Hwy 290 Unit 1-7
- TBD E Us Hwy 290 Unit 6
- TBD E Us Hwy 290 Unit 7
- TBD E Us Hwy 290 Unit 1-3
- 440 Bob Moritz Dr
- 85 Wisteria Dr
- 458 Bob Moritz Dr
- 63 Wisteria Dr
- 340 Bob Moritz Dr
- 470 Bob Moritz Dr
- 108 Wisteria Dr
- 395 Bob Moritz Dr
- 314 Bob Moritz Dr
- 78 Wisteria Dr
- 496 Bob Moritz Dr
- 48 Wisteria Dr
- 223 Maple St
- 245 Maple St
- 207 Maple St
- 263 Maple St
- 185 Maple St
- 0 Bob Moritz Dr
- 516 Bob Moritz Dr
- 295 Bob Moritz Dr