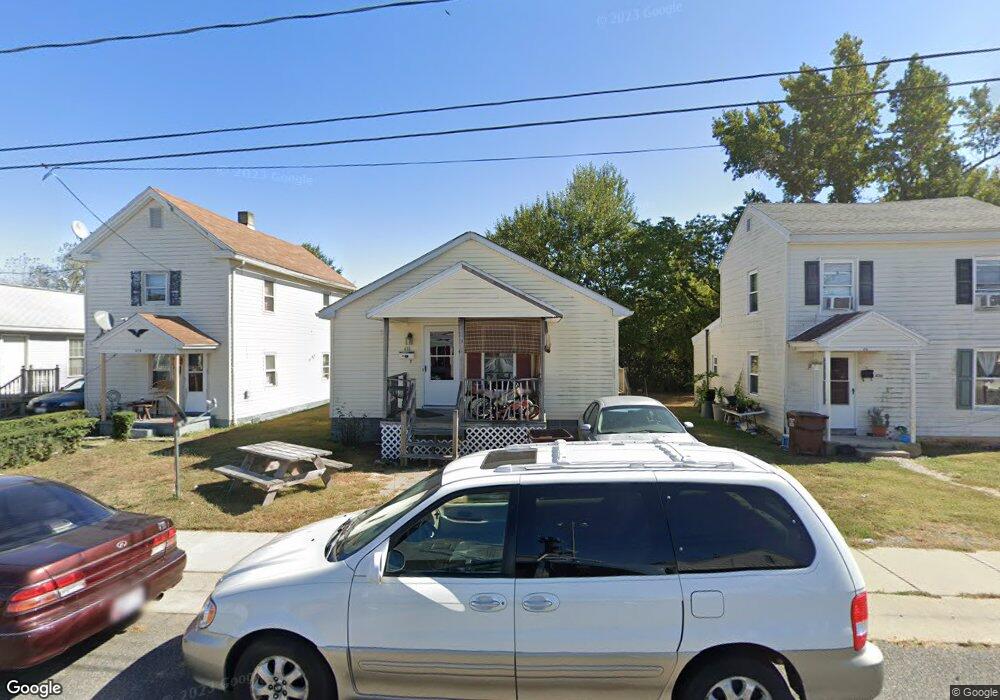
418 Camper St Cambridge, MD 21613
Estimated Value: $113,000 - $185,000
Studio
2
Baths
1,056
Sq Ft
$142/Sq Ft
Est. Value
About This Home
This home is located at 418 Camper St, Cambridge, MD 21613 and is currently estimated at $149,779, approximately $141 per square foot. 418 Camper St is a home located in Dorchester County with nearby schools including Sandy Hill Elementary School, Mace's Lane Middle School, and Cambridge-South Dorchester High School.
Ownership History
Date
Name
Owned For
Owner Type
Purchase Details
Closed on
May 8, 2007
Sold by
Option One Mortgage Corporation
Bought by
Mcb Rentals Llc
Current Estimated Value
Purchase Details
Closed on
Aug 28, 2006
Sold by
Saunders William A and Saunders Teresa B
Bought by
Option One Mortage Corporation
Purchase Details
Closed on
Aug 22, 2006
Sold by
Saunders William A and Saunders Teresa B
Bought by
Option One Mortage Corporation
Purchase Details
Closed on
Feb 3, 2003
Sold by
Neighborhood Housing Renewal Co
Bought by
Saunders William A and Saunders Teresa B
Create a Home Valuation Report for This Property
The Home Valuation Report is an in-depth analysis detailing your home's value as well as a comparison with similar homes in the area
Home Values in the Area
Average Home Value in this Area
Purchase History
| Date | Buyer | Sale Price | Title Company |
|---|---|---|---|
| Mcb Rentals Llc | $51,000 | -- | |
| Option One Mortage Corporation | $121,000 | -- | |
| Option One Mortage Corporation | $121,000 | -- | |
| Saunders William A | $75,000 | -- |
Source: Public Records
Mortgage History
| Date | Status | Borrower | Loan Amount |
|---|---|---|---|
| Closed | Saunders William A | -- |
Source: Public Records
Tax History
| Year | Tax Paid | Tax Assessment Tax Assessment Total Assessment is a certain percentage of the fair market value that is determined by local assessors to be the total taxable value of land and additions on the property. | Land | Improvement |
|---|---|---|---|---|
| 2025 | $1,482 | $78,900 | $5,900 | $73,000 |
| 2024 | $1,042 | $67,633 | $0 | $0 |
| 2023 | $1,042 | $56,367 | $0 | $0 |
| 2022 | $834 | $45,100 | $5,900 | $39,200 |
| 2021 | $851 | $45,100 | $5,900 | $39,200 |
| 2020 | $851 | $45,100 | $5,900 | $39,200 |
| 2019 | $888 | $46,600 | $5,900 | $40,700 |
| 2018 | $865 | $46,600 | $5,900 | $40,700 |
| 2017 | $865 | $46,600 | $0 | $0 |
| 2016 | -- | $54,100 | $0 | $0 |
| 2015 | $1,074 | $54,100 | $0 | $0 |
| 2014 | $1,074 | $54,100 | $0 | $0 |
Source: Public Records
Map
Nearby Homes
- 0 Park Ln
- 832 Park Ln
- 0 Edgewood Ave Unit MDDO2010918
- 0 Edgewood Ave Unit MDDO2010930
- 0 Edgewood Ave Unit MDDO2010928
- 0 Edgewood Ave Unit MDDO2010924
- 0 Edgewood Ave Unit MDDO2010926
- 0 Edgewood Ave Unit MDDO2010932
- 814 Park Ln
- 453 High St
- 816 Fairmount Ave
- 521 Edgewood Ave
- 606 Edgewood Ave
- 607 Edgewood Ave
- 506 High St
- 810 Locust St
- 409 Oakley St
- 402 Oakley St
- 430 Leonards Ln
- 616 Hubert St
Your Personal Tour Guide
Ask me questions while you tour the home.