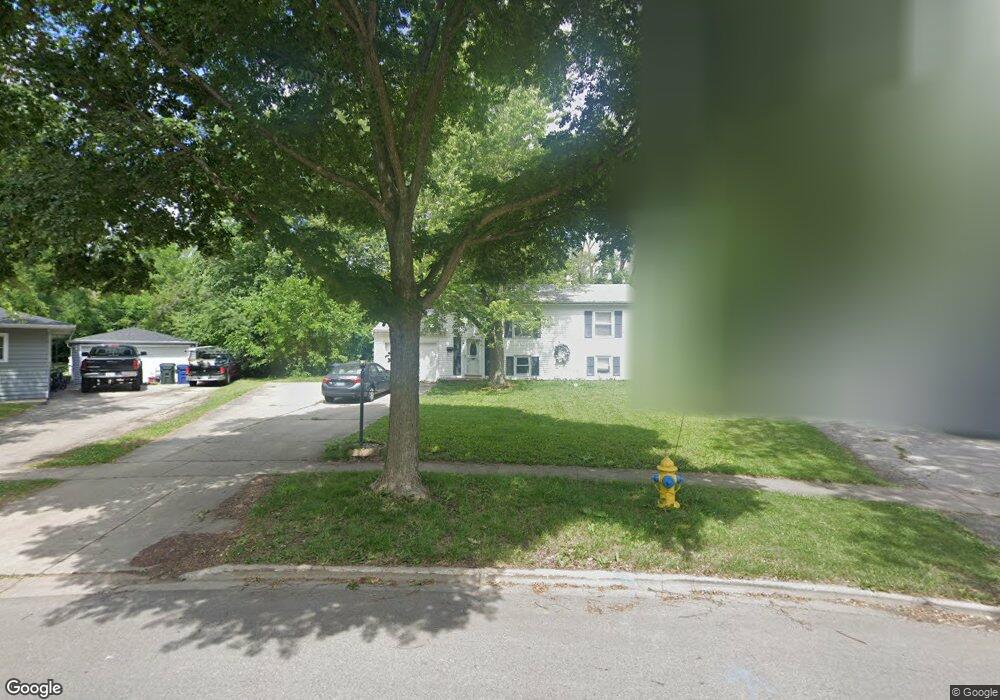
418 Cherry Valley Rd Unit 1 Vernon Hills, IL 60061
Estimated Value: $332,000 - $440,000
4
Beds
2
Baths
1,820
Sq Ft
$207/Sq Ft
Est. Value
About This Home
This home is located at 418 Cherry Valley Rd Unit 1, Vernon Hills, IL 60061 and is currently estimated at $376,499, approximately $206 per square foot. 418 Cherry Valley Rd Unit 1 is a home located in Lake County with nearby schools including Hawthorn School Of Dual Language, Hawthorn Elementary School South, and Hawthorn Middle School South.
Ownership History
Date
Name
Owned For
Owner Type
Purchase Details
Closed on
Oct 6, 2017
Sold by
Dunne Anthony J
Bought by
Csma Blt Llc
Current Estimated Value
Purchase Details
Closed on
Jun 30, 2004
Sold by
Sasaki Tamiko
Bought by
Dunne Anthony J
Home Financials for this Owner
Home Financials are based on the most recent Mortgage that was taken out on this home.
Original Mortgage
$221,476
Interest Rate
5.67%
Mortgage Type
FHA
Purchase Details
Closed on
Sep 26, 1995
Sold by
Koutsulis John S and Koutsulis Eileen Q
Bought by
Dunne Anthony and Sasaki Tamiko
Home Financials for this Owner
Home Financials are based on the most recent Mortgage that was taken out on this home.
Original Mortgage
$148,300
Interest Rate
8%
Mortgage Type
Assumption
Create a Home Valuation Report for This Property
The Home Valuation Report is an in-depth analysis detailing your home's value as well as a comparison with similar homes in the area
Home Values in the Area
Average Home Value in this Area
Purchase History
| Date | Buyer | Sale Price | Title Company |
|---|---|---|---|
| Csma Blt Llc | $223,000 | Fidelity National Title | |
| Dunne Anthony J | -- | Chicago Title Insurance Comp | |
| Dunne Anthony | $144,000 | 1St American Title |
Source: Public Records
Mortgage History
| Date | Status | Borrower | Loan Amount |
|---|---|---|---|
| Previous Owner | Dunne Anthony J | $221,476 | |
| Previous Owner | Dunne Anthony | $148,300 |
Source: Public Records
Tax History Compared to Growth
Tax History
| Year | Tax Paid | Tax Assessment Tax Assessment Total Assessment is a certain percentage of the fair market value that is determined by local assessors to be the total taxable value of land and additions on the property. | Land | Improvement |
|---|---|---|---|---|
| 2024 | $7,345 | $89,971 | $31,644 | $58,327 |
| 2023 | $6,561 | $78,605 | $27,646 | $50,959 |
| 2022 | $6,561 | $70,541 | $24,810 | $45,731 |
| 2021 | $6,354 | $69,780 | $24,542 | $45,238 |
| 2020 | $6,254 | $70,018 | $24,626 | $45,392 |
| 2019 | $6,132 | $69,760 | $24,535 | $45,225 |
| 2018 | $6,779 | $81,020 | $26,675 | $54,345 |
| 2017 | $6,492 | $79,128 | $26,052 | $53,076 |
| 2016 | $6,239 | $75,771 | $24,947 | $50,824 |
| 2015 | $6,135 | $70,860 | $23,330 | $47,530 |
| 2014 | $6,583 | $74,434 | $25,057 | $49,377 |
| 2012 | $6,438 | $74,583 | $25,107 | $49,476 |
Source: Public Records
Map
Nearby Homes
- 190 Southgate Dr
- 210 E Lakeside Dr
- 713 N Lakeside Dr
- 35 Charles Ct
- 717 N Lakeside Dr
- 835 Waterview Cir Unit 4
- 835 Waterview Cir Unit 2
- 234 Us Highway 45
- 382 Birchwood Ct Unit 82C
- 361 Ashwood Ct Unit 75D
- 128 Lilly Ct
- 820 N Lakeside Dr Unit 2D
- 126 S Fiore Pkwy
- 67 Shelby Ct
- 229 W Court of Shorewood Unit 3B
- 239 W Ct of Shorewood Unit 1B
- 15 Tanwood Ct Unit 52B
- 336 Westwood Ct Unit 42D
- 0 Endwood Dr
- 233 Harvest Ct
- 420 Cherry Valley Rd
- 416 Cherry Valley Rd
- 414 Cherry Valley Rd
- 422 Cherry Valley Rd
- 421 Cherry Valley Rd
- 9 Crestland Rd
- 10 Crestland Rd
- 424 Cherry Valley Rd
- 413 Cherry Valley Rd
- 8 Oakwood Rd
- 423 Cherry Valley Rd
- 410 Cherry Valley Rd
- 291 Oakwood Rd
- 11 Crestland Rd
- 293 Oakwood Rd
- 426 Cherry Valley Rd
- 302 Westmoreland Dr Unit 1
- 502 Cherry Valley Rd
- 425 Cherry Valley Rd
- 504 Cherry Valley Rd