C
Landlord's Agent in 2020
Christopher Mendola
Christone Enterprises, Inc.
(618) 624-2502

Estimated Value: $168,342 - $180,000
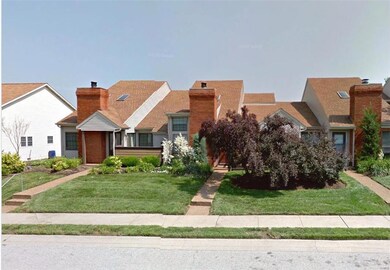
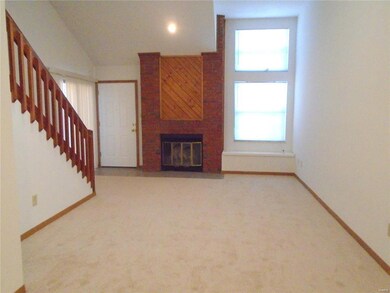
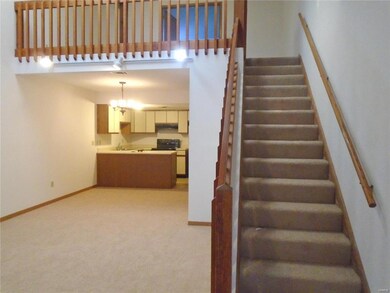
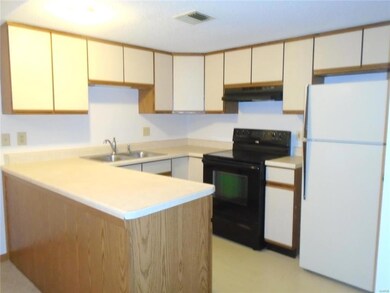
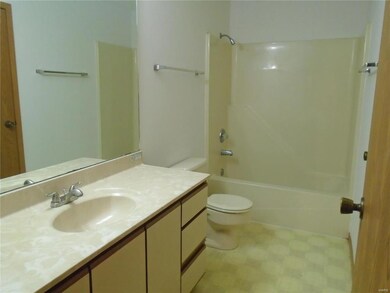
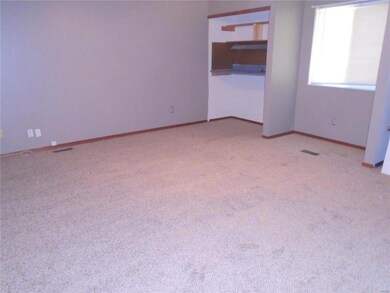
Townhouse in Georgetown Subdivision Location, 16 x 14 Living Room, 12 x 9 Kitchen Provides Electric Range, Dishwasher and Refrigerator, Adjacent Dining Area Provides Back Patio Access, Main Floor Half Bathroom, Second Floor Provides 14 x 10 Master Bedroom and 10 x 9 Second Bedroom, Full Hallway Bathroom and Laundry Area, 24 x 17 Two Car Attached Garage and Off Street Parking, Available 11/23/2020.
Last Agent to Rent the Property
Christone Enterprises, Inc. License #471015551 Listed on: 10/23/2020
Last Renter's Agent
Christone Enterprises, Inc. License #471015551 Listed on: 10/23/2020
| Date | Buyer | Sale Price | Title Company |
|---|---|---|---|
| Trend Development Llc | -- | None Available | |
| Trend Development Llc | -- | None Available |
| Date | Event | Price | List to Sale | Price per Sq Ft |
|---|---|---|---|---|
| 11/13/2020 11/13/20 | Rented | $1,025 | 0.0% | -- |
| 11/04/2020 11/04/20 | Under Contract | -- | -- | -- |
| 10/23/2020 10/23/20 | For Rent | $1,025 | -2.4% | -- |
| 10/03/2019 10/03/19 | Rented | $1,050 | 0.0% | -- |
| 09/27/2019 09/27/19 | For Rent | $1,050 | +5.0% | -- |
| 10/10/2018 10/10/18 | Rented | $1,000 | 0.0% | -- |
| 09/07/2018 09/07/18 | For Rent | $1,000 | -2.4% | -- |
| 10/09/2017 10/09/17 | Rented | $1,025 | +5.1% | -- |
| 08/03/2017 08/03/17 | Price Changed | $975 | -4.9% | $1 / Sq Ft |
| 07/18/2017 07/18/17 | For Rent | $1,025 | -- | -- |
| Year | Tax Paid | Tax Assessment Tax Assessment Total Assessment is a certain percentage of the fair market value that is determined by local assessors to be the total taxable value of land and additions on the property. | Land | Improvement |
|---|---|---|---|---|
| 2024 | $3,257 | $44,683 | $4,214 | $40,469 |
| 2023 | $3,005 | $39,658 | $3,740 | $35,918 |
| 2022 | $2,842 | $36,460 | $3,438 | $33,022 |
| 2021 | $2,637 | $33,209 | $3,450 | $29,759 |
| 2020 | $2,619 | $31,435 | $3,265 | $28,170 |
| 2019 | $2,562 | $31,435 | $3,265 | $28,170 |
| 2018 | $2,497 | $30,522 | $3,170 | $27,352 |
| 2017 | $2,538 | $29,916 | $3,305 | $26,611 |
| 2016 | $2,531 | $29,218 | $3,228 | $25,990 |
| 2014 | $2,344 | $28,880 | $3,191 | $25,689 |
| 2013 | $2,162 | $28,438 | $3,143 | $25,295 |
C
Landlord's Agent in 2020
Christopher Mendola
Christone Enterprises, Inc.
(618) 624-2502
Source: MARIS MLS
MLS Number: MIS20077380
APN: 04-31.0-217-039
Disclaimer: Certain information contained herein is derived from information provided by parties other than Homes.com. All information provided is deemed reliable, but is not guaranteed to be accurate and should be independently verified.
![]() Based on information submitted to the MLS GRID. All data is obtained from various sources and may not have been verified by broker or MLS GRID. Supplied Open House Information is subject to change without notice. All information should be independently reviewed and verified for accuracy. Properties may or may not be listed by the office/agent presenting the information. Some IDX listings have been excluded from this website.
Based on information submitted to the MLS GRID. All data is obtained from various sources and may not have been verified by broker or MLS GRID. Supplied Open House Information is subject to change without notice. All information should be independently reviewed and verified for accuracy. Properties may or may not be listed by the office/agent presenting the information. Some IDX listings have been excluded from this website.
Based on information submitted to the MLS GRID
Ask me questions while you tour the home.
