Estimated Value: $55,000 - $116,000
2
Beds
1
Bath
896
Sq Ft
$86/Sq Ft
Est. Value
About This Home
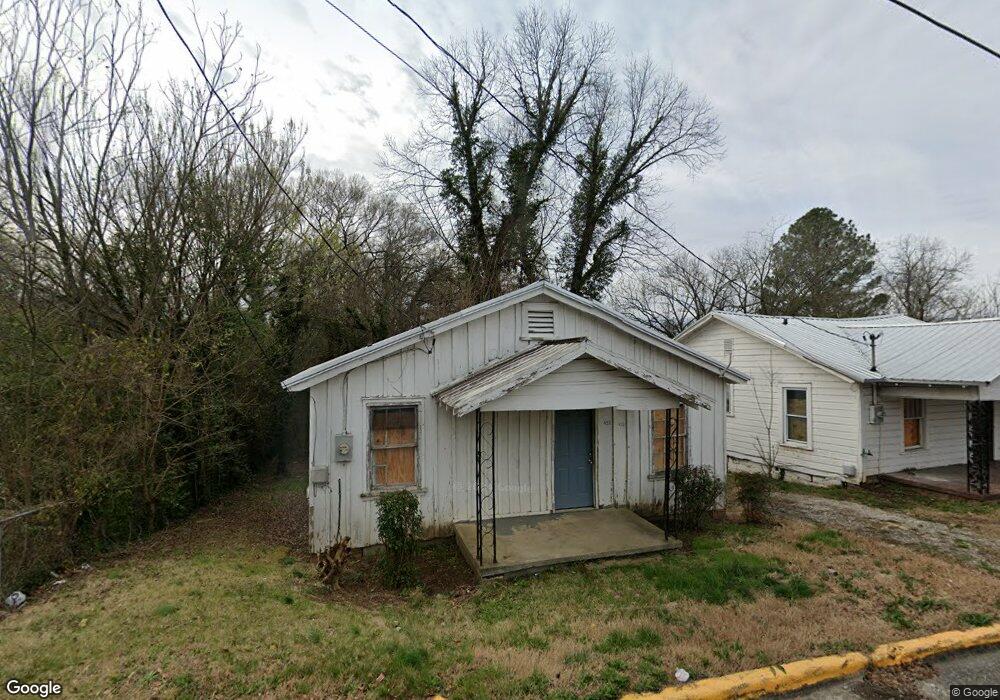
This home is located at 418 E 12th St SW, Rome, GA 30161 and is currently estimated at $77,328, approximately $86 per square foot. 418 E 12th St SW is a home located in Floyd County with nearby schools including Dan McCarty Middle School, Rome High School, and St. Mary School.
Ownership History
Date
Name
Owned For
Owner Type
Purchase Details
Closed on
May 5, 2025
Sold by
Pk Georgia Holdings Llc
Bought by
Plex Turret Llc
Current Estimated Value
Purchase Details
Closed on
Mar 12, 2024
Sold by
North Whitfield Mini Warehouses Llc
Bought by
Pk Georgia Holdings Llc
Purchase Details
Closed on
Jan 10, 2007
Sold by
Not Provided
Bought by
North Whitfield Mini Warehouse Llc
Purchase Details
Closed on
Sep 6, 2001
Sold by
Berry Tom
Bought by
Berry Tom and Jane Berry
Purchase Details
Closed on
Aug 29, 2001
Sold by
Taylor Helen
Bought by
Berry Tom
Purchase Details
Closed on
May 21, 1996
Sold by
Hannah Mattie West
Bought by
Taylor Helen
Purchase Details
Closed on
Apr 1, 1991
Sold by
Hannah Mattie West Mrs
Bought by
Hannah Mattie West
Purchase Details
Closed on
Jun 13, 1974
Sold by
Hannah Jordan and Hannah Mattie
Bought by
Hannah Mattie West Mrs
Purchase Details
Closed on
Jan 1, 1901
Bought by
Hannah Jordan and Hannah Mattie
Create a Home Valuation Report for This Property
The Home Valuation Report is an in-depth analysis detailing your home's value as well as a comparison with similar homes in the area
Home Values in the Area
Average Home Value in this Area
Purchase History
| Date | Buyer | Sale Price | Title Company |
|---|---|---|---|
| Plex Turret Llc | $90,000 | -- | |
| Pk Georgia Holdings Llc | $50,000 | -- | |
| North Whitfield Mini Warehouse Llc | $144,000 | -- | |
| Berry Tom | -- | -- | |
| Berry Tom | $5,900 | -- | |
| Taylor Helen | -- | -- | |
| Hannah Mattie West | $12,000 | -- | |
| Hannah Mattie West Mrs | -- | -- | |
| Hannah Jordan | -- | -- |
Source: Public Records
Tax History Compared to Growth
Tax History
| Year | Tax Paid | Tax Assessment Tax Assessment Total Assessment is a certain percentage of the fair market value that is determined by local assessors to be the total taxable value of land and additions on the property. | Land | Improvement |
|---|---|---|---|---|
| 2024 | $651 | $16,687 | $3,824 | $12,863 |
| 2023 | $591 | $16,320 | $3,477 | $12,843 |
| 2022 | $483 | $13,235 | $2,782 | $10,453 |
| 2021 | $446 | $12,017 | $2,782 | $9,235 |
| 2020 | $380 | $10,144 | $2,173 | $7,971 |
| 2019 | $353 | $9,543 | $2,173 | $7,370 |
| 2018 | $328 | $8,864 | $2,173 | $6,691 |
| 2017 | $315 | $8,510 | $2,173 | $6,337 |
| 2016 | $308 | $8,298 | $2,160 | $6,138 |
| 2015 | $291 | $8,298 | $2,160 | $6,138 |
| 2014 | $291 | $8,298 | $2,160 | $6,138 |
Source: Public Records
Map
Nearby Homes
- 31 Notasulga Dr SW
- 9 Eastridge Ct SW
- 170 E 11th St SW
- 162 E 11th St SE
- 168 E 11th St SE
- 164 E 11th St SE
- 166 E 11th St SW
- 211 E 11th St SE
- 2 E 10th St SW
- 4 E 15th St SW
- 415 E 10th St SE
- 801 Maple Ave SW
- 1314 E 2nd Ave SE
- 39 E 16th St SW
- 2 Fair St SW
- 414 E 17th St SW
- 13 Townview Rd SE
- 0 Turnbull Dr SE Unit 10570009
- E 12th St SW
- 416 E 12th St SW
- 420 E 12th St SW
- 414 E 12th St SW
- 412 E 12th St SE
- 422 E 12th St SW
- 10 E 10th St SW
- 410 E 12th St SW
- 408 E 12th St SW
- 409 E 13th St SW
- 405 E 12th St SW
- 419 E 13th St SW
- 406 E 12th St SW
- E E 12th St SE
- 424 E 12th St SW
- 407 E 13th St SW
- 405 E 13th St SW
- 1205 Spring Creek St SW
- 423 E 13th St SW
- 27 Notasulga Dr SW