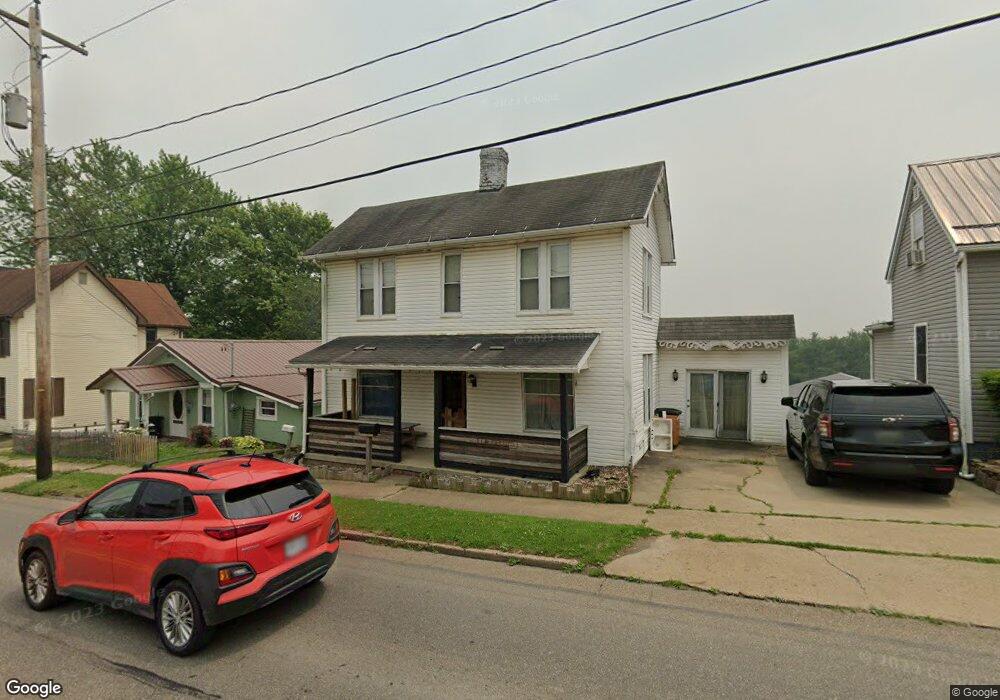
418 E Main St Barnesville, OH 43713
Estimated Value: $96,000 - $161,000
3
Beds
1
Bath
1,769
Sq Ft
$72/Sq Ft
Est. Value
About This Home
This home is located at 418 E Main St, Barnesville, OH 43713 and is currently estimated at $128,061, approximately $72 per square foot. 418 E Main St is a home located in Belmont County with nearby schools including Barnesville Elementary School, Barnesville Middle School, and Barnesville High School.
Ownership History
Date
Name
Owned For
Owner Type
Purchase Details
Closed on
Apr 18, 2018
Sold by
Lough Betty Jean
Bought by
Lough Charles Jason
Current Estimated Value
Purchase Details
Closed on
Mar 26, 2016
Sold by
Mcginnis Chester C and Mcginnis Carolyn M
Bought by
Lough Betty Jean
Purchase Details
Closed on
Jan 25, 2016
Sold by
Mcginnis Chester C and Mcginnis Carolyn M
Bought by
Mcginnis Chester C and Mcginnis Carolyn M
Purchase Details
Closed on
Sep 21, 2011
Sold by
Walker Barbara A
Bought by
Mcginnis Chester C and Mcginnis Carolyn M
Purchase Details
Closed on
Jan 1, 1987
Sold by
Walker Barbara A and Walker Paul R
Bought by
Walker Barbara A and Walker Paul R
Create a Home Valuation Report for This Property
The Home Valuation Report is an in-depth analysis detailing your home's value as well as a comparison with similar homes in the area
Home Values in the Area
Average Home Value in this Area
Purchase History
| Date | Buyer | Sale Price | Title Company |
|---|---|---|---|
| Lough Charles Jason | -- | None Available | |
| Lough Betty Jean | -- | Attorney | |
| Mcginnis Chester C | -- | Attorney | |
| Mcginnis Chester C | $20,000 | None Available | |
| Walker Barbara A | -- | -- |
Source: Public Records
Tax History
| Year | Tax Paid | Tax Assessment Tax Assessment Total Assessment is a certain percentage of the fair market value that is determined by local assessors to be the total taxable value of land and additions on the property. | Land | Improvement |
|---|---|---|---|---|
| 2025 | $640 | $19,460 | $2,780 | $16,680 |
| 2024 | $630 | $19,460 | $2,780 | $16,680 |
| 2023 | $822 | $24,360 | $2,570 | $21,790 |
| 2022 | $821 | $24,354 | $2,566 | $21,788 |
| 2021 | $823 | $24,354 | $2,566 | $21,788 |
| 2020 | $721 | $20,410 | $2,140 | $18,270 |
| 2019 | $724 | $20,410 | $2,140 | $18,270 |
| 2018 | $724 | $20,410 | $2,140 | $18,270 |
| 2017 | $721 | $19,980 | $3,060 | $16,920 |
| 2016 | $677 | $19,980 | $3,060 | $16,920 |
| 2015 | $675 | $19,980 | $3,060 | $16,920 |
| 2014 | $661 | $19,370 | $2,780 | $16,590 |
| 2013 | $661 | $19,370 | $2,780 | $16,590 |
Source: Public Records
Map
Nearby Homes
- 613 E Main St
- 152 E Main St
- 126 Oak St
- 438 N Lincoln Ave
- 724 E Main St
- 118 Pine Ln
- 202 Walton Ave
- 164 Pine Ln
- 617 Park St
- 618 Park St
- 0 Fairmont Ave Unit 5163774
- 0 Fairmont Ave Unit 5163784
- 0 Tract 17 Brown Peavine Rd Rd
- TBD W Main St
- 62239 Hillcrest Rd
- 0 County Road 114
- Lot 1 Cattle Dr
- 0 Nevada Rd
- 57128 Somerton Hwy
- 0 Johnson Bethel Rd
Your Personal Tour Guide
Ask me questions while you tour the home.