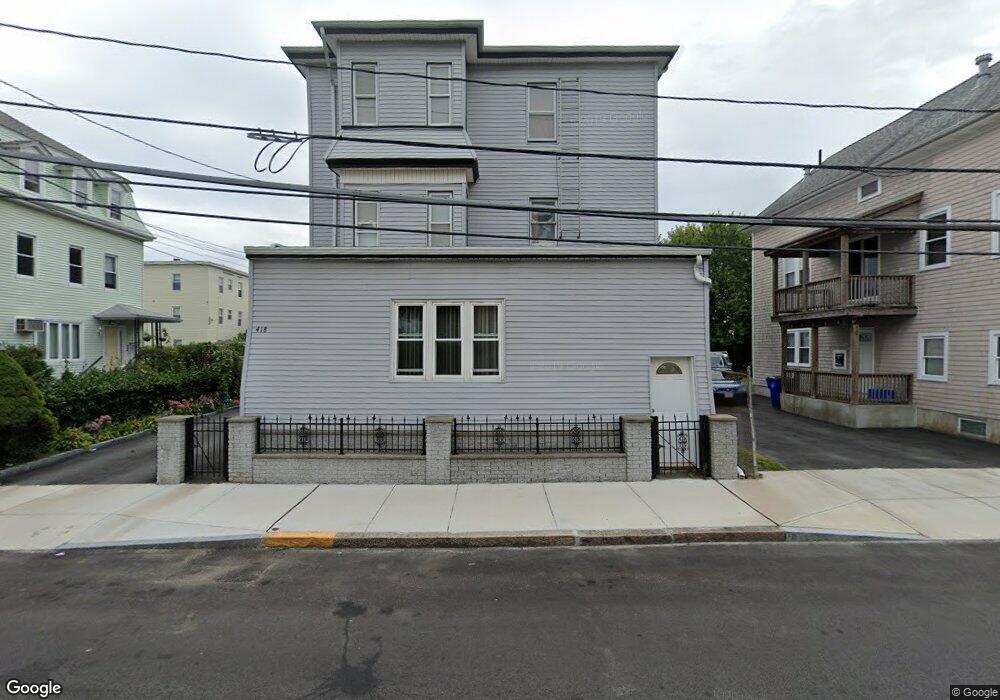
418 E Main St Fall River, MA 02724
Father Kelly NeighborhoodEstimated Value: $674,000 - $732,000
9
Beds
3
Baths
4,216
Sq Ft
$165/Sq Ft
Est. Value
About This Home
This home is located at 418 E Main St, Fall River, MA 02724 and is currently estimated at $697,000, approximately $165 per square foot. 418 E Main St is a home located in Bristol County with nearby schools including Carlton M. Viveiros Elementary School, Matthew J. Kuss Middle School, and B M C Durfee High School.
Ownership History
Date
Name
Owned For
Owner Type
Purchase Details
Closed on
Apr 25, 2024
Sold by
Demelo Joshua
Bought by
Demelo Angela and Medeiros Linda M
Current Estimated Value
Purchase Details
Closed on
Jun 6, 2019
Sold by
Demelo Joseph and Demelo Lucy
Bought by
Medeiros Linda M and Demelo Joshua R
Purchase Details
Closed on
Oct 27, 2008
Sold by
Mello Jeremiah and Belchior Laina
Bought by
Demelo Joseph L and Demelo Lucy M
Purchase Details
Closed on
Jun 27, 1989
Sold by
Mello Leo S
Bought by
Demelo Joseph
Create a Home Valuation Report for This Property
The Home Valuation Report is an in-depth analysis detailing your home's value as well as a comparison with similar homes in the area
Home Values in the Area
Average Home Value in this Area
Purchase History
| Date | Buyer | Sale Price | Title Company |
|---|---|---|---|
| Demelo Angela | -- | None Available | |
| Demelo Angela | -- | None Available | |
| Medeiros Linda M | -- | -- | |
| Medeiros Linda M | -- | -- | |
| Demelo Joseph L | $150,000 | -- | |
| Demelo Joseph L | $150,000 | -- | |
| Demelo Joseph | $146,000 | -- |
Source: Public Records
Mortgage History
| Date | Status | Borrower | Loan Amount |
|---|---|---|---|
| Previous Owner | Demelo Joseph | $55,000 | |
| Previous Owner | Demelo Joseph | $61,000 | |
| Previous Owner | Demelo Joseph | $115,000 |
Source: Public Records
Tax History
| Year | Tax Paid | Tax Assessment Tax Assessment Total Assessment is a certain percentage of the fair market value that is determined by local assessors to be the total taxable value of land and additions on the property. | Land | Improvement |
|---|---|---|---|---|
| 2025 | $6,507 | $568,300 | $104,100 | $464,200 |
| 2024 | $6,179 | $537,800 | $97,200 | $440,600 |
| 2023 | $5,515 | $449,500 | $81,600 | $367,900 |
| 2022 | $4,563 | $385,200 | $77,700 | $307,500 |
| 2021 | $4,563 | $329,900 | $74,300 | $255,600 |
| 2020 | $4,036 | $279,300 | $71,900 | $207,400 |
| 2019 | $3,428 | $235,100 | $71,900 | $163,200 |
| 2018 | $3,313 | $226,600 | $81,000 | $145,600 |
| 2017 | $3,119 | $222,800 | $77,200 | $145,600 |
| 2016 | $3,052 | $223,900 | $82,100 | $141,800 |
| 2015 | $2,929 | $223,900 | $82,100 | $141,800 |
| 2014 | $2,966 | $235,800 | $79,700 | $156,100 |
Source: Public Records
Map
Nearby Homes
- 426 E Main St
- 392 E Main St
- 394 E Main St
- 365 Montaup St Unit 3 West
- 365 Montaup St Unit 3rd West
- 365 Montaup St
- 448 E Main St
- 380 E Main St
- 403 E Main St
- 427 E Main St
- 837 Globe St
- 1068 Slade St Unit 1
- 1068 Slade St Unit 2E
- 1068 Slade St Unit 2W
- 1068 Slade St Unit 3
- 1068 Slade St Unit 4
- 1068 Slade St
- 357 Montaup St
- 379 E Main St
- 411 E Main St
Your Personal Tour Guide
Ask me questions while you tour the home.