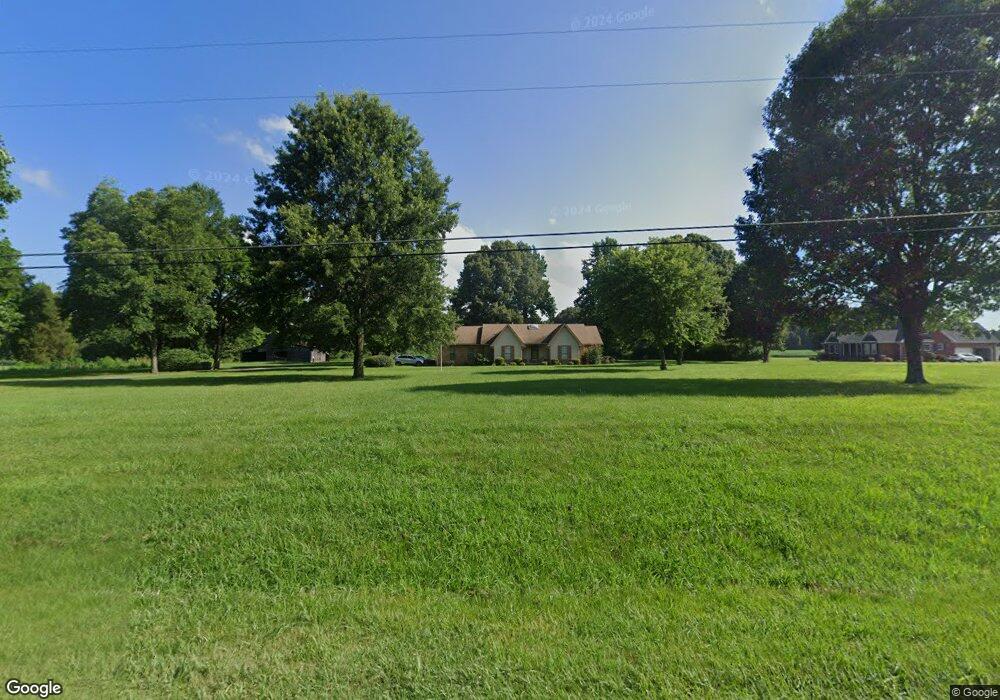
418 E Union St Gleason, TN 38229
Estimated Value: $316,578 - $489,000
Studio
2
Baths
2,546
Sq Ft
$142/Sq Ft
Est. Value
About This Home
This home is located at 418 E Union St, Gleason, TN 38229 and is currently estimated at $361,895, approximately $142 per square foot. 418 E Union St is a home located in Weakley County.
Ownership History
Date
Name
Owned For
Owner Type
Purchase Details
Closed on
May 12, 2022
Sold by
Swyers George W
Bought by
James Jonathan and Esch Erika
Current Estimated Value
Home Financials for this Owner
Home Financials are based on the most recent Mortgage that was taken out on this home.
Original Mortgage
$285,000
Outstanding Balance
$270,090
Interest Rate
5.3%
Mortgage Type
New Conventional
Estimated Equity
$91,805
Purchase Details
Closed on
Nov 14, 2016
Sold by
Sawyers George W
Bought by
Sawyers George W and Weaver Alison Sawyers
Purchase Details
Closed on
Jul 2, 2015
Sold by
Sawyers Jerry L
Bought by
Sawyers George W and Sawyers Brenda W
Purchase Details
Closed on
Jul 19, 1996
Bought by
Sawyers George
Purchase Details
Closed on
Oct 31, 1991
Bought by
Williamson Paul
Purchase Details
Closed on
Oct 14, 1983
Sold by
Sawyers Dudley C Maggie B
Bought by
Sawyers George W and Sawyers Brenda W
Create a Home Valuation Report for This Property
The Home Valuation Report is an in-depth analysis detailing your home's value as well as a comparison with similar homes in the area
Purchase History
| Date | Buyer | Sale Price | Title Company |
|---|---|---|---|
| James Jonathan | $300,000 | Unger & Godwin | |
| Sawyers George W | -- | -- | |
| Sawyers George W | $26,703 | -- | |
| Sawyers George | $15,000 | -- | |
| Williamson Paul | $18,000 | -- | |
| Sawyers George W | $1,500 | -- |
Source: Public Records
Mortgage History
| Date | Status | Borrower | Loan Amount |
|---|---|---|---|
| Open | James Jonathan | $285,000 |
Source: Public Records
Tax History
| Year | Tax Paid | Tax Assessment Tax Assessment Total Assessment is a certain percentage of the fair market value that is determined by local assessors to be the total taxable value of land and additions on the property. | Land | Improvement |
|---|---|---|---|---|
| 2025 | -- | $73,550 | $10,400 | $63,150 |
| 2024 | -- | $73,550 | $10,400 | $63,150 |
| 2023 | $1,865 | $73,550 | $10,400 | $63,150 |
| 2022 | $1,423 | $39,150 | $3,775 | $35,375 |
| 2021 | $1,423 | $39,150 | $3,775 | $35,375 |
| 2020 | $772 | $39,150 | $3,775 | $35,375 |
| 2019 | $1,423 | $39,150 | $3,775 | $35,375 |
| 2018 | $1,423 | $39,150 | $3,775 | $35,375 |
| 2017 | $1,421 | $40,150 | $3,275 | $36,875 |
| 2016 | $1,421 | $40,150 | $0 | $0 |
| 2015 | $1,438 | $40,621 | $0 | $0 |
| 2014 | $61 | $1,734 | $0 | $0 |
Source: Public Records
Map
Nearby Homes
- 108 Erwin St
- 106 Erwin St
- 0 Tennessee 22
- 408 S Cedar St
- 101 Oak Ln
- 433 S Cedar St
- 3723 Tennessee 22
- 509 N Cedar St
- 508 W Main St
- 134 E Ashley Dr
- 703 N Cedar St
- 116 Carlton Terrace
- 206 Hopewell St
- 203 Peace and Harmony Rd
- 2345 E Grove Rd
- 1041 Garrett Rd
- 2366 Sandhill Rd
- 611 Tumbling Creek Rd
- 2481 Pillowville Gleason Rd
- 6509 Tennessee 124
Your Personal Tour Guide
Ask me questions while you tour the home.