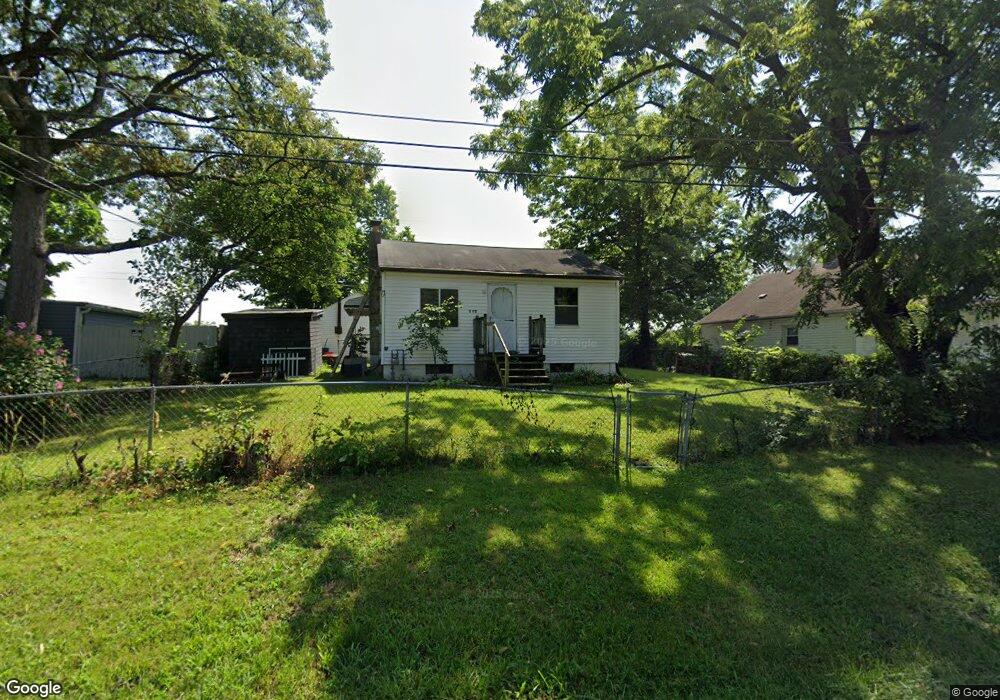
418 Emmit Ave Columbus, OH 43228
Estimated Value: $92,000 - $156,000
2
Beds
1
Bath
576
Sq Ft
$211/Sq Ft
Est. Value
About This Home
This home is located at 418 Emmit Ave, Columbus, OH 43228 and is currently estimated at $121,780, approximately $211 per square foot. 418 Emmit Ave is a home located in Franklin County with nearby schools including Stiles Elementary School, Galloway Ridge Intermediate School, and Norton Middle School.
Ownership History
Date
Name
Owned For
Owner Type
Purchase Details
Closed on
Aug 5, 2025
Sold by
Walton Phillip D and Walton Dan W
Bought by
Hurtado Joel and Hurtado Jose Luis
Current Estimated Value
Purchase Details
Closed on
Jul 1, 2003
Sold by
Republic Bank
Bought by
Walton Phillip D and Walton Dan W
Purchase Details
Closed on
May 20, 2003
Sold by
Conner Eric C and Case #02Cve01 540
Bought by
Republic Bank
Purchase Details
Closed on
Mar 14, 2001
Sold by
Connor Alicia A
Bought by
Conner Alicia A and Conner Eric C
Purchase Details
Closed on
Sep 25, 2000
Sold by
Connor Eric C
Bought by
Connor Alicia A
Purchase Details
Closed on
Aug 16, 1995
Sold by
Ross Charles
Bought by
Eric C Conner
Home Financials for this Owner
Home Financials are based on the most recent Mortgage that was taken out on this home.
Original Mortgage
$30,000
Interest Rate
7.64%
Mortgage Type
New Conventional
Create a Home Valuation Report for This Property
The Home Valuation Report is an in-depth analysis detailing your home's value as well as a comparison with similar homes in the area
Home Values in the Area
Average Home Value in this Area
Purchase History
| Date | Buyer | Sale Price | Title Company |
|---|---|---|---|
| Hurtado Joel | $100,000 | None Listed On Document | |
| Walton Phillip D | $25,900 | Benchmark Title Agency Inc | |
| Republic Bank | $28,000 | -- | |
| Conner Alicia A | -- | -- | |
| Connor Alicia A | -- | -- | |
| Eric C Conner | $34,000 | -- |
Source: Public Records
Mortgage History
| Date | Status | Borrower | Loan Amount |
|---|---|---|---|
| Previous Owner | Eric C Conner | $30,000 |
Source: Public Records
Tax History
| Year | Tax Paid | Tax Assessment Tax Assessment Total Assessment is a certain percentage of the fair market value that is determined by local assessors to be the total taxable value of land and additions on the property. | Land | Improvement |
|---|---|---|---|---|
| 2025 | $1,188 | $25,770 | $13,340 | $12,430 |
| 2024 | $1,188 | $25,770 | $13,340 | $12,430 |
| 2023 | $1,134 | $25,760 | $13,335 | $12,425 |
| 2022 | $1,265 | $20,200 | $3,960 | $16,240 |
| 2021 | $1,286 | $20,200 | $3,960 | $16,240 |
| 2020 | $1,281 | $20,200 | $3,960 | $16,240 |
| 2019 | $1,268 | $17,470 | $3,330 | $14,140 |
| 2018 | $1,123 | $17,470 | $3,330 | $14,140 |
| 2017 | $1,090 | $17,470 | $3,330 | $14,140 |
| 2016 | $981 | $13,060 | $3,430 | $9,630 |
| 2015 | $981 | $13,060 | $3,430 | $9,630 |
| 2014 | $982 | $13,060 | $3,430 | $9,630 |
| 2013 | $572 | $15,365 | $4,025 | $11,340 |
Source: Public Records
Map
Nearby Homes
- 546 Emmit Ave
- 377 S Murray Hill Rd
- 495 Daytona Rd
- 257 S Murray Hill Rd
- 4682 Arnold Ave
- 4637 Hilton Ave
- 470 Woodlawn Ave
- 415 Georgesville Rd
- 4848 Deephollow Dr
- 104 Oxley Rd
- 4723 Tarryton Ct S Unit 14-E
- 429 Postle Blvd
- 87 Tarryton Ct W Unit 18D
- 89 Postle Blvd
- 97 Tarryton Ct W Unit 19-H
- 110 Inah Ave
- 218 Darbyhurst Rd
- 4518 Hall Rd
- 329 Weymouth Ln
- 3977 Sexton Dr
Your Personal Tour Guide
Ask me questions while you tour the home.