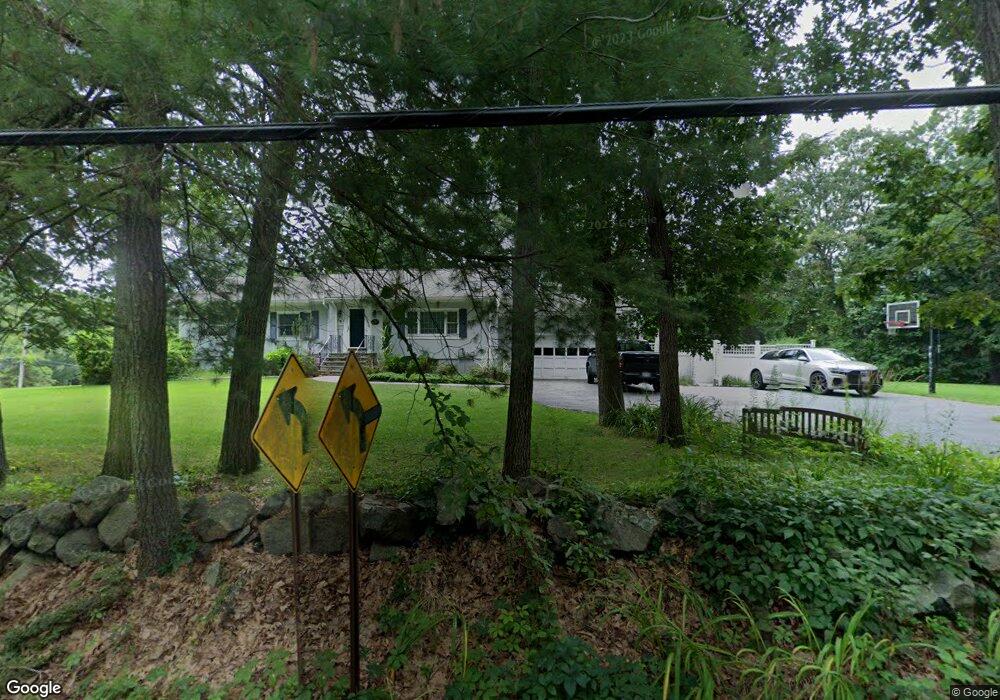
418 Glen Rd Weston, MA 02493
Estimated Value: $1,130,863 - $2,517,000
3
Beds
3
Baths
1,352
Sq Ft
$1,283/Sq Ft
Est. Value
About This Home
This home is located at 418 Glen Rd, Weston, MA 02493 and is currently estimated at $1,733,966, approximately $1,282 per square foot. 418 Glen Rd is a home located in Middlesex County with nearby schools including Country Elementary School, Woodland Elementary School, and Field Elementary School.
Ownership History
Date
Name
Owned For
Owner Type
Purchase Details
Closed on
Oct 27, 1998
Sold by
Mattson Vernon M and Brown Ellenf
Bought by
Grundy Adrian R and Grundy Lisa G
Current Estimated Value
Purchase Details
Closed on
Jun 24, 1987
Sold by
Powell Margaret H
Bought by
Mattson Dorothy A
Create a Home Valuation Report for This Property
The Home Valuation Report is an in-depth analysis detailing your home's value as well as a comparison with similar homes in the area
Home Values in the Area
Average Home Value in this Area
Purchase History
| Date | Buyer | Sale Price | Title Company |
|---|---|---|---|
| Grundy Adrian R | $399,120 | -- | |
| Mattson Dorothy A | $336,000 | -- |
Source: Public Records
Mortgage History
| Date | Status | Borrower | Loan Amount |
|---|---|---|---|
| Open | Mattson Dorothy A | $396,000 | |
| Closed | Mattson Dorothy A | $165,000 | |
| Closed | Mattson Dorothy A | $400,000 |
Source: Public Records
Tax History
| Year | Tax Paid | Tax Assessment Tax Assessment Total Assessment is a certain percentage of the fair market value that is determined by local assessors to be the total taxable value of land and additions on the property. | Land | Improvement |
|---|---|---|---|---|
| 2025 | $9,401 | $846,900 | $549,300 | $297,600 |
| 2024 | $8,846 | $795,500 | $549,300 | $246,200 |
| 2023 | $8,878 | $749,800 | $549,300 | $200,500 |
| 2022 | $8,630 | $673,700 | $516,500 | $157,200 |
| 2021 | $4,997 | $640,700 | $491,000 | $149,700 |
| 2020 | $8,220 | $640,700 | $491,000 | $149,700 |
| 2019 | $7,592 | $603,000 | $455,700 | $147,300 |
| 2018 | $7,327 | $585,700 | $455,700 | $130,000 |
| 2017 | $7,263 | $585,700 | $455,700 | $130,000 |
| 2016 | $7,122 | $585,700 | $455,700 | $130,000 |
| 2015 | $6,877 | $560,000 | $433,900 | $126,100 |
Source: Public Records
Map
Nearby Homes
- 100 Westcliff Rd
- 556 Wellesley St
- 568 Wellesley St
- 300 Glen Rd
- 48 Scotch Pine Rd
- 169 Hickory Rd
- 84 Royalston Rd
- 14 Greylock Rd
- 200 Cliff Rd
- 120 Rockport Rd
- 64 Oak St
- 45 White Oak Rd
- 65 Woodcliff Rd
- 141 Hampshire Rd
- 22 Cranmore Rd
- 162 Hampshire Rd
- 3 Ravine Rd
- 2 Candleberry Ln
- 6 Meadowbrook Rd
- 78 Suffolk Rd
Your Personal Tour Guide
Ask me questions while you tour the home.