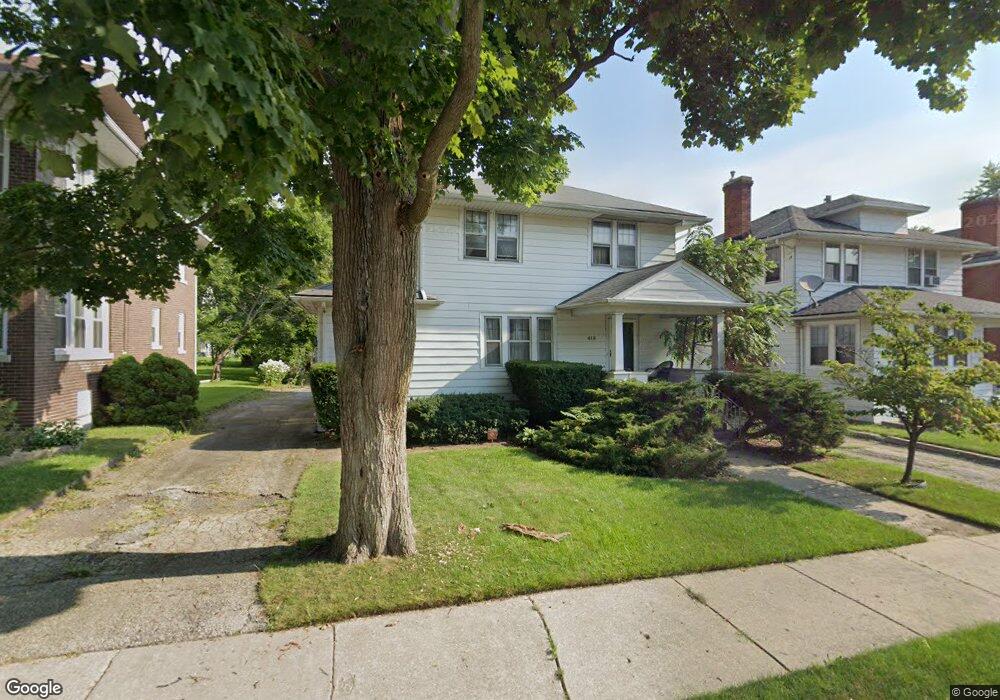
418 Hull Ct Waukegan, IL 60085
Estimated Value: $225,284 - $236,000
4
Beds
1
Bath
1,512
Sq Ft
$152/Sq Ft
Est. Value
About This Home
This home is located at 418 Hull Ct, Waukegan, IL 60085 and is currently estimated at $229,321, approximately $151 per square foot. 418 Hull Ct is a home located in Lake County with nearby schools including Edith M Smith Middle School, Waukegan High School, and LEARN 10 Charter School.
Ownership History
Date
Name
Owned For
Owner Type
Purchase Details
Closed on
Aug 10, 2011
Sold by
Heneghan Steven J
Bought by
Heneghan Steven J and The Steven J Heneghan Living T
Current Estimated Value
Purchase Details
Closed on
Dec 4, 2008
Sold by
Heneghan Craig D and Estate Of Beverly W Heneghan
Bought by
Heneghan Craig D and Heneghan Steven J
Create a Home Valuation Report for This Property
The Home Valuation Report is an in-depth analysis detailing your home's value as well as a comparison with similar homes in the area
Home Values in the Area
Average Home Value in this Area
Purchase History
| Date | Buyer | Sale Price | Title Company |
|---|---|---|---|
| Heneghan Steven J | -- | None Available | |
| Heneghan Craig D | -- | None Available |
Source: Public Records
Tax History Compared to Growth
Tax History
| Year | Tax Paid | Tax Assessment Tax Assessment Total Assessment is a certain percentage of the fair market value that is determined by local assessors to be the total taxable value of land and additions on the property. | Land | Improvement |
|---|---|---|---|---|
| 2024 | $4,308 | $59,582 | $7,391 | $52,191 |
| 2023 | $4,129 | $53,686 | $6,617 | $47,069 |
| 2022 | $4,129 | $48,235 | $6,294 | $41,941 |
| 2021 | $3,710 | $41,590 | $5,614 | $35,976 |
| 2020 | $3,712 | $38,746 | $5,230 | $33,516 |
| 2019 | $3,683 | $35,504 | $4,792 | $30,712 |
| 2018 | $3,922 | $35,550 | $6,106 | $29,444 |
| 2017 | $3,621 | $31,452 | $5,402 | $26,050 |
| 2016 | $3,296 | $27,330 | $4,694 | $22,636 |
| 2015 | $3,118 | $24,461 | $4,201 | $20,260 |
| 2014 | $2,786 | $22,005 | $4,703 | $17,302 |
| 2012 | $3,673 | $23,842 | $5,097 | $18,745 |
Source: Public Records
Map
Nearby Homes
- 415 W Ridgeland Ave
- 918 N Ash St
- 723 N County St
- 1110 N Ash St
- 325 4th St
- 1122 N Ash St
- 611 N Genesee St
- 620 N Poplar St
- 702 Franklin St
- 522 N Poplar St
- 452 North Ave
- 1336 N Ash St
- 1335 Chestnut St
- 428 N Poplar St
- 511 Chestnut St
- 917 N Linden Ave
- 1109 Massena Ave
- 1105 Woodlawn Cir
- 1000 Pine St
- 1312 N Linden Ave
- 426 Hull Ct
- 416 Hull Ct
- 412 Hull Ct
- 430 Hull Ct
- 421 W Ridgeland Ave
- 417 W Ridgeland Ave
- 423 W Ridgeland Ave
- 408 Hull Ct
- 421 Hull Ct
- 417 Hull Ct
- 434 Hull Ct
- 434 Hull Ct Unit 1
- 434 Hull Ct Unit 2
- 415 Hull Ct
- 429 W Ridgeland Ave
- 411 W Ridgeland Ave
- 429 Hull Ct
- 411 Hull Ct
- 330 Hull Ct
- 433 W Ridgeland Ave