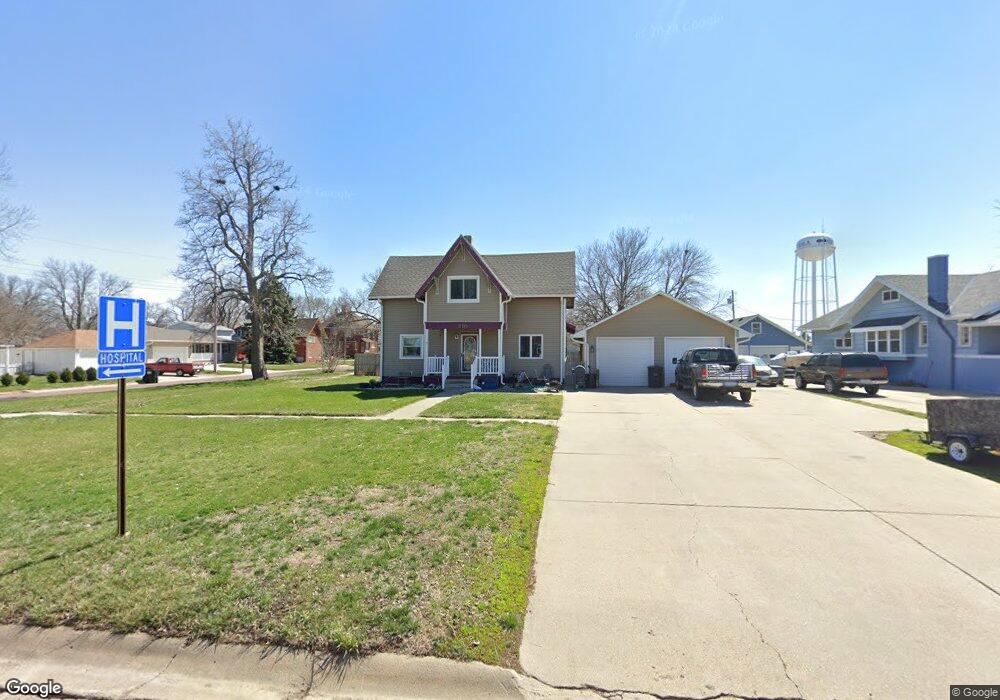
418 M St Aurora, NE 68818
Estimated Value: $235,994 - $253,000
4
Beds
3
Baths
1,992
Sq Ft
$122/Sq Ft
Est. Value
About This Home
This home is located at 418 M St, Aurora, NE 68818 and is currently estimated at $242,749, approximately $121 per square foot. 418 M St is a home located in Hamilton County with nearby schools including Aurora Elementary School, Aurora Middle School, and Aurora High School.
Ownership History
Date
Name
Owned For
Owner Type
Purchase Details
Closed on
Oct 29, 2020
Sold by
Ohlson Tracy L and Ohlson Cory L
Bought by
Ohlson Cory L and Ohlson Tracy L
Current Estimated Value
Purchase Details
Closed on
Nov 1, 2019
Sold by
Wonch Chad E and Wonch Kenji D
Bought by
Brandt Jeremy and Brandt Dawn
Home Financials for this Owner
Home Financials are based on the most recent Mortgage that was taken out on this home.
Original Mortgage
$124,949
Outstanding Balance
$108,677
Interest Rate
3.37%
Mortgage Type
FHA
Estimated Equity
$134,072
Create a Home Valuation Report for This Property
The Home Valuation Report is an in-depth analysis detailing your home's value as well as a comparison with similar homes in the area
Home Values in the Area
Average Home Value in this Area
Purchase History
| Date | Buyer | Sale Price | Title Company |
|---|---|---|---|
| Ohlson Cory L | -- | None Available | |
| Brandt Jeremy | $146,000 | -- |
Source: Public Records
Mortgage History
| Date | Status | Borrower | Loan Amount |
|---|---|---|---|
| Open | Brandt Jeremy | $124,949 |
Source: Public Records
Tax History
| Year | Tax Paid | Tax Assessment Tax Assessment Total Assessment is a certain percentage of the fair market value that is determined by local assessors to be the total taxable value of land and additions on the property. | Land | Improvement |
|---|---|---|---|---|
| 2025 | $1,694 | $181,770 | $17,390 | $164,380 |
| 2024 | $1,694 | $156,390 | $17,390 | $139,000 |
| 2023 | $2,045 | $144,910 | $17,390 | $127,520 |
| 2022 | $2,168 | $144,910 | $17,390 | $127,520 |
| 2021 | $1,732 | $113,915 | $17,390 | $96,525 |
| 2020 | $1,688 | $113,915 | $17,390 | $96,525 |
| 2019 | $1,572 | $106,765 | $17,390 | $89,375 |
| 2018 | $1,503 | $106,765 | $17,390 | $89,375 |
| 2017 | $1,443 | $102,420 | $13,045 | $89,375 |
| 2016 | $1,267 | $92,570 | $10,435 | $82,135 |
| 2010 | $1,202 | $63,410 | $0 | $0 |
Source: Public Records
Map
Nearby Homes
Your Personal Tour Guide
Ask me questions while you tour the home.