Estimated Value: $151,000 - $304,000
3
Beds
--
Bath
2,064
Sq Ft
$98/Sq Ft
Est. Value
About This Home
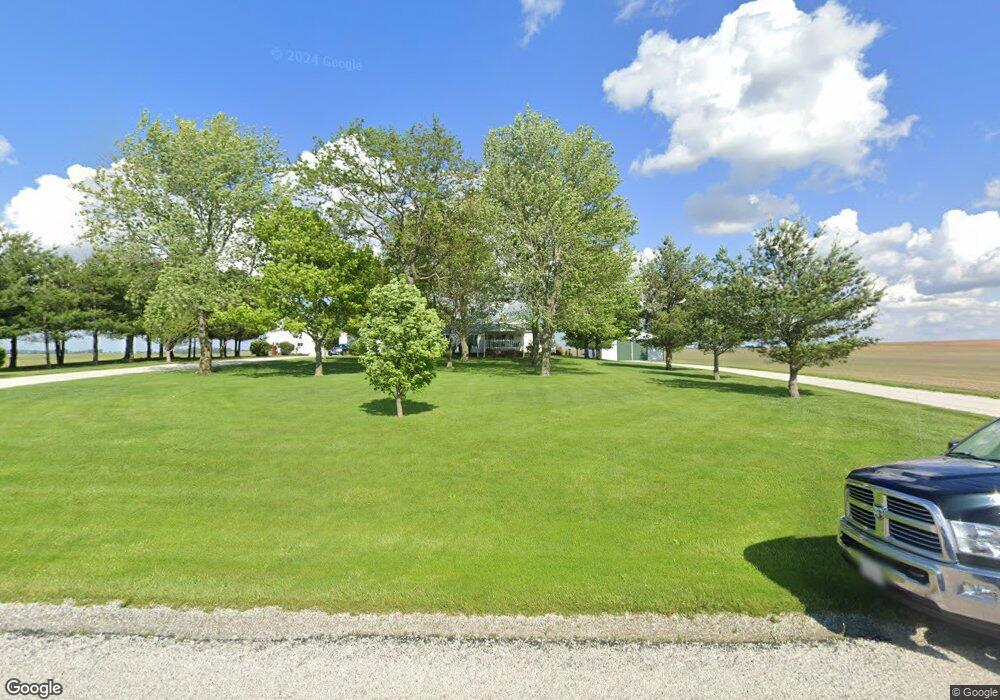
This home is located at 418 N 2000 East Rd, Pana, IL 62557 and is currently estimated at $201,768, approximately $97 per square foot. 418 N 2000 East Rd is a home located in Christian County with nearby schools including Washington Elementary School, Lincoln Elementary School, and Pana Jr High School.
Ownership History
Date
Name
Owned For
Owner Type
Purchase Details
Closed on
Jan 21, 2025
Sold by
Ade James E
Bought by
James E Ade Trust and Ade
Current Estimated Value
Purchase Details
Closed on
Feb 24, 2021
Sold by
Ade Mary C
Bought by
Ade James E
Purchase Details
Closed on
Jun 14, 2011
Sold by
Ade James E and Ade Myra Anne
Bought by
Ade James Eric and Ade Mary C
Purchase Details
Closed on
Mar 15, 2006
Sold by
Welch James E
Bought by
Ade James Eric and Ade Mary C
Create a Home Valuation Report for This Property
The Home Valuation Report is an in-depth analysis detailing your home's value as well as a comparison with similar homes in the area
Home Values in the Area
Average Home Value in this Area
Purchase History
| Date | Buyer | Sale Price | Title Company |
|---|---|---|---|
| James E Ade Trust | -- | None Listed On Document | |
| Ade James E | -- | None Available | |
| Ade James Eric | -- | None Available | |
| Ade James Eric | $124,000 | None Available |
Source: Public Records
Tax History Compared to Growth
Tax History
| Year | Tax Paid | Tax Assessment Tax Assessment Total Assessment is a certain percentage of the fair market value that is determined by local assessors to be the total taxable value of land and additions on the property. | Land | Improvement |
|---|---|---|---|---|
| 2024 | $4,022 | $69,443 | $6,726 | $62,717 |
| 2023 | $3,747 | $63,282 | $6,559 | $56,723 |
| 2022 | $3,618 | $59,508 | $5,960 | $53,548 |
| 2021 | $3,637 | $58,837 | $5,837 | $53,000 |
| 2020 | $3,670 | $58,793 | $5,793 | $53,000 |
| 2019 | $3,747 | $59,588 | $5,346 | $54,242 |
| 2018 | $3,722 | $58,287 | $5,139 | $53,148 |
| 2017 | $3,689 | $57,387 | $4,994 | $52,393 |
| 2016 | $3,705 | $57,372 | $4,979 | $52,393 |
| 2015 | $3,671 | $55,925 | $4,568 | $51,357 |
| 2014 | $3,624 | $55,208 | $4,475 | $50,733 |
| 2013 | $3,674 | $55,194 | $4,461 | $50,733 |
| 2011 | $3,748 | $56,565 | $4,305 | $52,260 |
Source: Public Records
Map
Nearby Homes