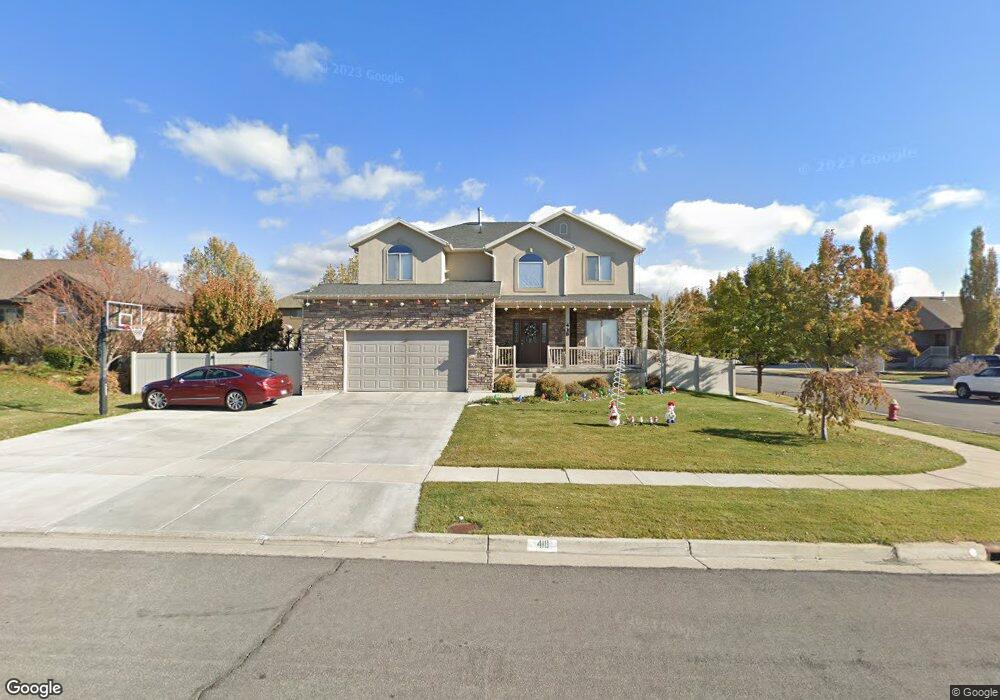
418 N 3550 W Layton, UT 84041
Estimated Value: $689,542 - $732,000
4
Beds
3
Baths
3,654
Sq Ft
$193/Sq Ft
Est. Value
About This Home
This home is located at 418 N 3550 W, Layton, UT 84041 and is currently estimated at $705,636, approximately $193 per square foot. 418 N 3550 W is a home located in Davis County with nearby schools including Sand Springs Elementary School, Legacy Junior High School, and Layton High School.
Ownership History
Date
Name
Owned For
Owner Type
Purchase Details
Closed on
Oct 11, 2007
Sold by
Decker Greg C
Bought by
Stander Chad E and Stander Kaylene
Current Estimated Value
Home Financials for this Owner
Home Financials are based on the most recent Mortgage that was taken out on this home.
Original Mortgage
$250,400
Outstanding Balance
$157,149
Interest Rate
6.4%
Mortgage Type
Purchase Money Mortgage
Estimated Equity
$548,487
Purchase Details
Closed on
Jan 20, 2006
Sold by
Mountain Green Development Llc
Bought by
Decker Greg C
Home Financials for this Owner
Home Financials are based on the most recent Mortgage that was taken out on this home.
Original Mortgage
$250,000
Interest Rate
6.28%
Mortgage Type
Construction
Create a Home Valuation Report for This Property
The Home Valuation Report is an in-depth analysis detailing your home's value as well as a comparison with similar homes in the area
Home Values in the Area
Average Home Value in this Area
Purchase History
| Date | Buyer | Sale Price | Title Company |
|---|---|---|---|
| Stander Chad E | -- | Security Title | |
| Decker Greg C | -- | Bonneville Title Company |
Source: Public Records
Mortgage History
| Date | Status | Borrower | Loan Amount |
|---|---|---|---|
| Open | Stander Chad E | $250,400 | |
| Previous Owner | Decker Greg C | $250,000 |
Source: Public Records
Tax History Compared to Growth
Tax History
| Year | Tax Paid | Tax Assessment Tax Assessment Total Assessment is a certain percentage of the fair market value that is determined by local assessors to be the total taxable value of land and additions on the property. | Land | Improvement |
|---|---|---|---|---|
| 2025 | $3,322 | $348,700 | $122,033 | $226,667 |
| 2024 | $3,188 | $337,150 | $131,322 | $205,828 |
| 2023 | $3,182 | $593,000 | $137,393 | $455,607 |
| 2022 | $3,434 | $347,600 | $80,909 | $266,691 |
| 2021 | $3,120 | $471,000 | $121,352 | $349,648 |
| 2020 | $2,797 | $405,000 | $103,419 | $301,581 |
| 2019 | $2,778 | $394,000 | $102,897 | $291,103 |
| 2018 | $2,570 | $366,000 | $90,601 | $275,399 |
| 2016 | $2,325 | $170,775 | $37,245 | $133,530 |
| 2015 | $2,234 | $155,815 | $37,245 | $118,570 |
| 2014 | $2,030 | $144,768 | $37,245 | $107,523 |
| 2013 | -- | $142,668 | $40,044 | $102,624 |
Source: Public Records
Map
Nearby Homes
- 436 N 3550 W
- 436 N 3550 W Unit 18
- 419 N 3550 W
- 419 N 3550 W Unit 11
- 435 N 3550 W
- 435 N 3550 W Unit 12
- 3537 W 400 N
- 3502 W 400 N Unit 20
- 3502 W 400 N
- 3513 W 400 N
- 3543 W 400 N
- 3559 W 400 N
- 453 N 3550 W
- 431 N 3475 W
- 3575 W 400 N
- 3575 W 400 N Unit 51
- 3497 W 400 N Unit 46
- 449 N 3475 W
- 420 N 3600 W Unit Lot 10
- 420 N 3600 W