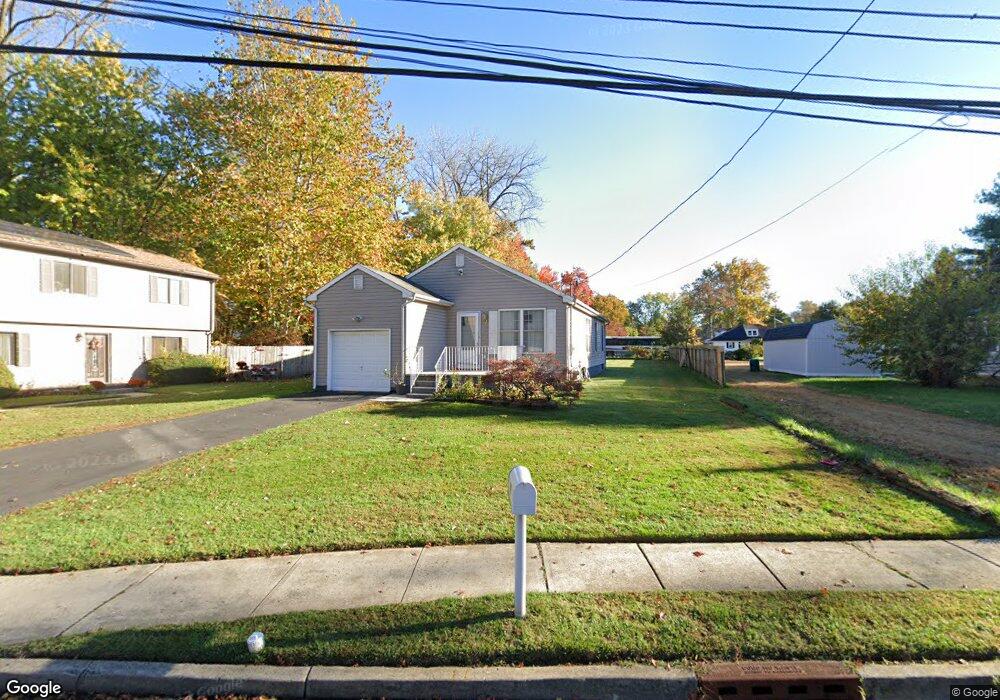
418 Pitman Ave Trenton, NJ 08610
Estimated Value: $328,000 - $459,000
--
Bed
--
Bath
1,252
Sq Ft
$316/Sq Ft
Est. Value
About This Home
This home is located at 418 Pitman Ave, Trenton, NJ 08610 and is currently estimated at $395,463, approximately $315 per square foot. 418 Pitman Ave is a home located in Mercer County with nearby schools including George E. Wilson Elementary School, Albert E. Grice Middle School, and Hamilton West-Watson High School.
Ownership History
Date
Name
Owned For
Owner Type
Purchase Details
Closed on
Oct 5, 2000
Sold by
Gres John
Bought by
Goez Byron and Gomez Olga
Current Estimated Value
Home Financials for this Owner
Home Financials are based on the most recent Mortgage that was taken out on this home.
Original Mortgage
$133,385
Outstanding Balance
$48,540
Interest Rate
7.89%
Mortgage Type
FHA
Estimated Equity
$346,923
Create a Home Valuation Report for This Property
The Home Valuation Report is an in-depth analysis detailing your home's value as well as a comparison with similar homes in the area
Home Values in the Area
Average Home Value in this Area
Purchase History
| Date | Buyer | Sale Price | Title Company |
|---|---|---|---|
| Goez Byron | $133,500 | -- |
Source: Public Records
Mortgage History
| Date | Status | Borrower | Loan Amount |
|---|---|---|---|
| Open | Goez Byron | $133,385 |
Source: Public Records
Tax History Compared to Growth
Tax History
| Year | Tax Paid | Tax Assessment Tax Assessment Total Assessment is a certain percentage of the fair market value that is determined by local assessors to be the total taxable value of land and additions on the property. | Land | Improvement |
|---|---|---|---|---|
| 2025 | $7,221 | $204,900 | $34,900 | $170,000 |
| 2024 | $6,768 | $204,900 | $34,900 | $170,000 |
| 2023 | $6,768 | $204,900 | $34,900 | $170,000 |
| 2022 | $6,661 | $204,900 | $34,900 | $170,000 |
| 2021 | $8,243 | $204,900 | $34,900 | $170,000 |
| 2020 | $7,505 | $204,900 | $34,900 | $170,000 |
| 2019 | $7,284 | $204,900 | $34,900 | $170,000 |
| 2018 | $7,188 | $204,900 | $34,900 | $170,000 |
| 2017 | $6,868 | $204,900 | $34,900 | $170,000 |
| 2016 | $5,541 | $204,900 | $34,900 | $170,000 |
| 2015 | $6,412 | $123,100 | $21,000 | $102,100 |
| 2014 | $6,329 | $123,100 | $21,000 | $102,100 |
Source: Public Records
Map
Nearby Homes