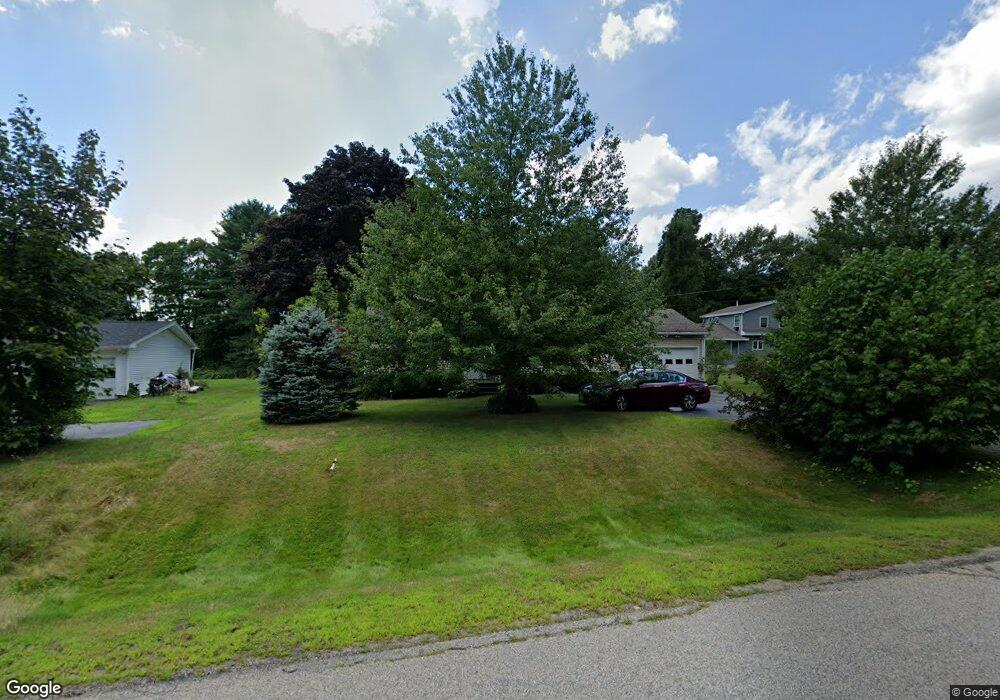
418 Pool St Biddeford, ME 04005
South Biddeford NeighborhoodEstimated Value: $454,562 - $586,000
2
Beds
2
Baths
1,448
Sq Ft
$360/Sq Ft
Est. Value
About This Home
This home is located at 418 Pool St, Biddeford, ME 04005 and is currently estimated at $520,641, approximately $359 per square foot. 418 Pool St is a home located in York County with nearby schools including John F Kennedy Memorial School, Biddeford Primary School, and Biddeford Intermediate School.
Ownership History
Date
Name
Owned For
Owner Type
Purchase Details
Closed on
Feb 18, 2011
Sold by
Poissant Teresa A and Poissant Daniel H
Bought by
Cote Anita J
Current Estimated Value
Home Financials for this Owner
Home Financials are based on the most recent Mortgage that was taken out on this home.
Original Mortgage
$125,000
Outstanding Balance
$84,855
Interest Rate
5%
Mortgage Type
Purchase Money Mortgage
Estimated Equity
$435,786
Purchase Details
Closed on
Aug 13, 2008
Sold by
Boissonneault Theresa L and Boissonneault Roland A
Bought by
Poissant Daniel H and Poissant Teresa A
Create a Home Valuation Report for This Property
The Home Valuation Report is an in-depth analysis detailing your home's value as well as a comparison with similar homes in the area
Home Values in the Area
Average Home Value in this Area
Purchase History
| Date | Buyer | Sale Price | Title Company |
|---|---|---|---|
| Cote Anita J | -- | -- | |
| Poissant Daniel H | -- | -- |
Source: Public Records
Mortgage History
| Date | Status | Borrower | Loan Amount |
|---|---|---|---|
| Open | Cote Anita J | $125,000 |
Source: Public Records
Tax History
| Year | Tax Paid | Tax Assessment Tax Assessment Total Assessment is a certain percentage of the fair market value that is determined by local assessors to be the total taxable value of land and additions on the property. | Land | Improvement |
|---|---|---|---|---|
| 2025 | $5,449 | $364,700 | $210,400 | $154,300 |
| 2024 | $5,323 | $374,300 | $210,400 | $163,900 |
| 2023 | $4,862 | $370,600 | $206,700 | $163,900 |
| 2022 | $4,823 | $293,900 | $139,800 | $154,100 |
| 2021 | $4,096 | $249,700 | $118,300 | $131,400 |
| 2020 | $3,994 | $223,700 | $103,000 | $120,700 |
| 2019 | $4,470 | $223,700 | $103,000 | $120,700 |
| 2018 | $106 | $223,700 | $103,000 | $120,700 |
| 2017 | $114 | $207,600 | $103,000 | $104,600 |
| 2016 | $4,123 | $207,600 | $103,000 | $104,600 |
| 2015 | $3,847 | $207,600 | $103,000 | $104,600 |
| 2014 | $3,752 | $207,600 | $103,000 | $104,600 |
| 2013 | -- | $218,900 | $106,700 | $112,200 |
Source: Public Records
Map
Nearby Homes
- 26 Meeting House Rd
- 5 Twin Island Dr
- 378 Pool St
- 625 Pool St
- 650 Pool St
- 353 Pool St
- 74 Guinea Rd
- 4 Walker Dr Unit 101
- 3 Walker Dr Unit 101
- 3 Walker Dr Unit 101
- 295 Ferry Rd
- TBD 530 Ferry Rd
- 9 Windward Ridge
- 8 Rockwood Dr
- 6 Decary Rd
- 30 Vines Rd
- 18 Camp Ellis Ave
- 1 Main Ave
- 10 Lower Beach Rd
- 38 Pine Ridge Rd
- 420 Pool St
- 8 Marblehead Ln
- 422 Pool St
- 424 Pool
- 11 Marblehead Ln
- 416 Pool St
- 12 Marblehead Ln
- 4 Marblehead Ln
- 428 Pool St
- 414 Pool St
- 13 Marblehead Ln
- 29 Meeting House Rd
- 25 Meeting House Rd
- 412 Pool St
- 38 Meeting House Rd Unit 40
- 417 Pool St
- 24 Meeting House Rd
- 0 Meeting House Rd
- 17 Marblehead Ln Unit 19
- 30 Meeting House Rd
Your Personal Tour Guide
Ask me questions while you tour the home.