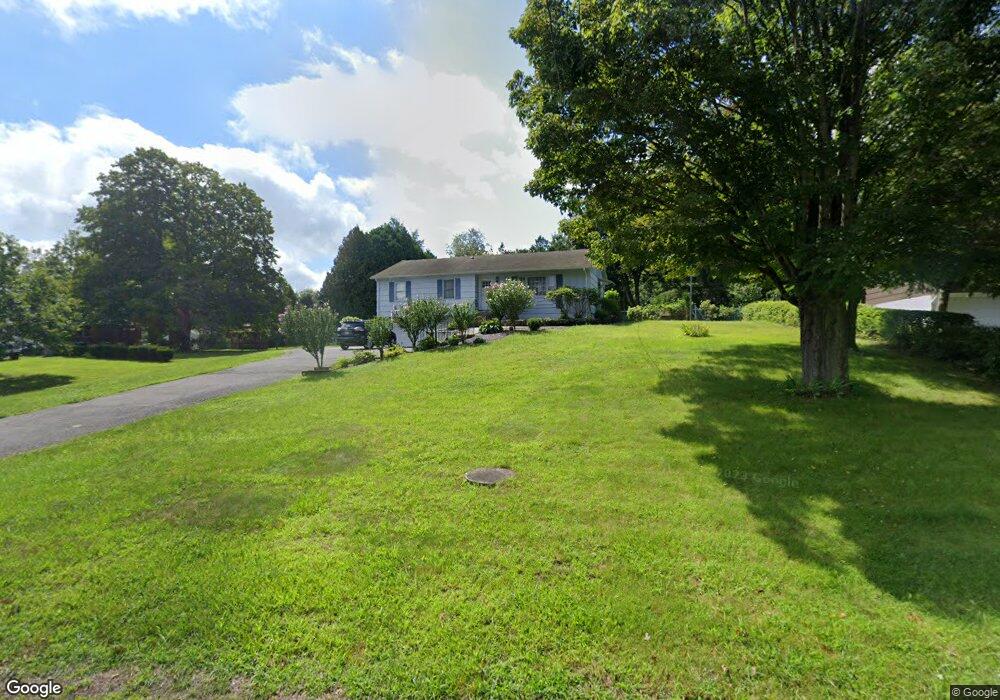
418 Poole St Ludlow, MA 01056
Estimated Value: $338,743 - $377,000
3
Beds
1
Bath
1,200
Sq Ft
$293/Sq Ft
Est. Value
About This Home
This home is located at 418 Poole St, Ludlow, MA 01056 and is currently estimated at $352,186, approximately $293 per square foot. 418 Poole St is a home located in Hampden County with nearby schools including East Street Elementary School, Chapin Street Elementary School, and Paul R. Baird Middle School.
Ownership History
Date
Name
Owned For
Owner Type
Purchase Details
Closed on
Jul 17, 2007
Sold by
Ricardi Donna P
Bought by
Stgermain Brennan and Esteves Sylvia
Current Estimated Value
Home Financials for this Owner
Home Financials are based on the most recent Mortgage that was taken out on this home.
Original Mortgage
$114,000
Interest Rate
6.48%
Mortgage Type
Purchase Money Mortgage
Create a Home Valuation Report for This Property
The Home Valuation Report is an in-depth analysis detailing your home's value as well as a comparison with similar homes in the area
Home Values in the Area
Average Home Value in this Area
Purchase History
| Date | Buyer | Sale Price | Title Company |
|---|---|---|---|
| Stgermain Brennan | $214,000 | -- | |
| Stgermain Brennan | $214,000 | -- |
Source: Public Records
Mortgage History
| Date | Status | Borrower | Loan Amount |
|---|---|---|---|
| Open | Stgermain Brennan | $138,000 | |
| Closed | Stgermain Brennan | $116,000 | |
| Closed | Stgermain Brennan | $114,000 |
Source: Public Records
Tax History Compared to Growth
Tax History
| Year | Tax Paid | Tax Assessment Tax Assessment Total Assessment is a certain percentage of the fair market value that is determined by local assessors to be the total taxable value of land and additions on the property. | Land | Improvement |
|---|---|---|---|---|
| 2025 | $4,317 | $248,800 | $77,200 | $171,600 |
| 2024 | $4,108 | $227,100 | $77,500 | $149,600 |
| 2023 | $3,849 | $197,300 | $64,400 | $132,900 |
| 2022 | $3,698 | $185,000 | $64,400 | $120,600 |
| 2021 | $3,746 | $177,700 | $64,400 | $113,300 |
| 2020 | $3,629 | $176,000 | $63,500 | $112,500 |
| 2019 | $3,409 | $172,000 | $62,900 | $109,100 |
| 2018 | $3,355 | $176,500 | $69,800 | $106,700 |
| 2017 | $3,276 | $176,800 | $67,800 | $109,000 |
| 2016 | $3,398 | $187,400 | $66,400 | $121,000 |
| 2015 | $3,214 | $185,900 | $65,700 | $120,200 |
Source: Public Records
Map
Nearby Homes
- 235 James St
- 1172 East St
- 143 James St
- 319 Ventura St
- 22 Balsam Hill Rd
- Lot 28 Tower Rd
- 956 Poole St
- 38 King Dr
- 308 Miller St Unit 72
- 308 Miller St Unit 79
- 308 Miller St Unit 78
- 229 Miller St Unit F-13
- 229 Miller St Unit C-1
- 229 Miller St Unit B2
- 225 Maynard Rd
- 88-90 Miller St
- 321 Westerly Cir
- 140 Waverly Rd
- 357 Westerly Cir
- 6 Hawthorne Rd
- 406 Poole St
- 436 Poole St
- 427 Poole St Unit 429
- 427 Poole St Unit 1
- 407 Poole St
- 465 Ventura St
- 439 Poole St Unit R
- 417 Poole St Unit 419
- 437 Poole St Unit 439
- 437 Poole St Unit L
- 461 Ventura St
- 449 Poole St
- 22 Moore St
- 9 Moore St
- 391 Poole St
- 464 Poole St
- 457 Ventura St
- 0 Poole St
- 464 Ventura St
- 459 Poole St