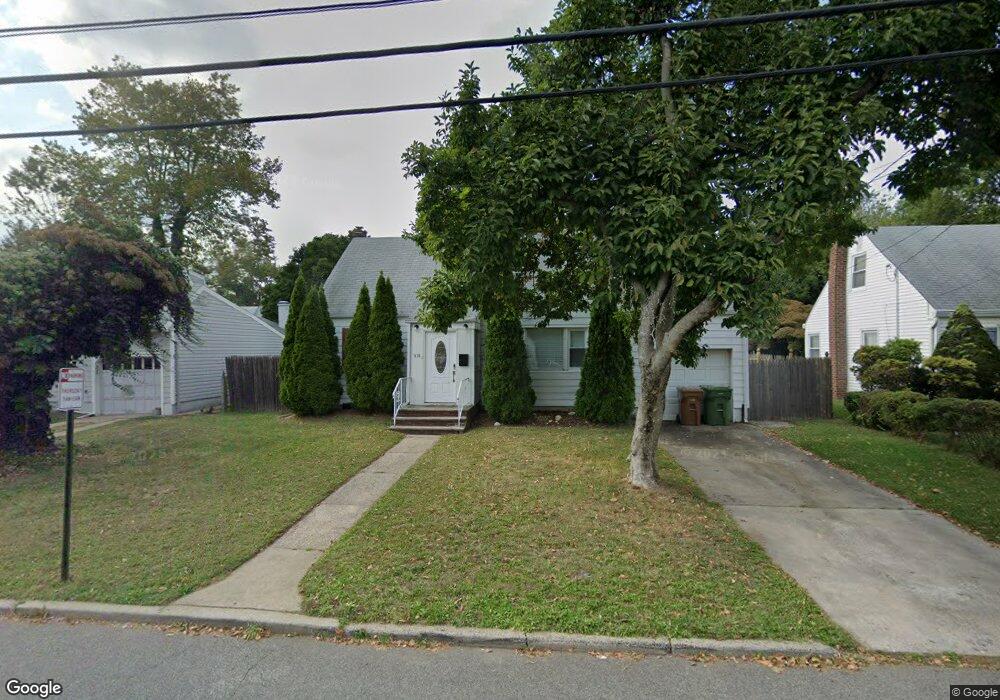
418 Princeton Rd Linden, NJ 07036
Estimated Value: $549,000 - $694,000
--
Bed
--
Bath
1,188
Sq Ft
$502/Sq Ft
Est. Value
About This Home
This home is located at 418 Princeton Rd, Linden, NJ 07036 and is currently estimated at $596,112, approximately $501 per square foot. 418 Princeton Rd is a home located in Union County with nearby schools including Deerfield Terrace School No. 9, Myles J. McManus Middle School, and Linden High School.
Ownership History
Date
Name
Owned For
Owner Type
Purchase Details
Closed on
Oct 25, 2022
Sold by
Weber Sara Devorah
Bought by
Weber Sara Devorah and Bernstein Benzion
Current Estimated Value
Home Financials for this Owner
Home Financials are based on the most recent Mortgage that was taken out on this home.
Original Mortgage
$432,250
Interest Rate
5.13%
Mortgage Type
New Conventional
Purchase Details
Closed on
Sep 16, 2022
Sold by
Kolesa Monica C
Bought by
Weber Sara Pevoran
Home Financials for this Owner
Home Financials are based on the most recent Mortgage that was taken out on this home.
Original Mortgage
$432,250
Interest Rate
5.13%
Mortgage Type
New Conventional
Purchase Details
Closed on
Nov 30, 2012
Sold by
Peter M & P Trust -Hudak R -M L/E
Bought by
Kolesa Monica C
Purchase Details
Closed on
Jun 12, 2007
Sold by
Pfeil Mary Ann
Bought by
Pfeil Mary Ann and Pfeil Peter
Purchase Details
Closed on
Nov 13, 2001
Sold by
Hudak Mary
Bought by
Pfeil Mary Ann and Hudak Robert G
Create a Home Valuation Report for This Property
The Home Valuation Report is an in-depth analysis detailing your home's value as well as a comparison with similar homes in the area
Home Values in the Area
Average Home Value in this Area
Purchase History
| Date | Buyer | Sale Price | Title Company |
|---|---|---|---|
| Weber Sara Devorah | -- | -- | |
| Weber Sara Devorah | -- | None Listed On Document | |
| Weber Sara Pevoran | $475,000 | -- | |
| Kolesa Monica C | $215,000 | -- | |
| Pfeil Mary Ann | -- | None Available | |
| Pfeil Mary Ann | -- | -- |
Source: Public Records
Mortgage History
| Date | Status | Borrower | Loan Amount |
|---|---|---|---|
| Previous Owner | Weber Sara Pevoran | $432,250 |
Source: Public Records
Tax History Compared to Growth
Tax History
| Year | Tax Paid | Tax Assessment Tax Assessment Total Assessment is a certain percentage of the fair market value that is determined by local assessors to be the total taxable value of land and additions on the property. | Land | Improvement |
|---|---|---|---|---|
| 2025 | $9,240 | $131,400 | $62,000 | $69,400 |
| 2024 | $9,038 | $131,400 | $62,000 | $69,400 |
| 2023 | $9,038 | $131,400 | $62,000 | $69,400 |
| 2022 | $9,085 | $131,400 | $62,000 | $69,400 |
| 2021 | $9,131 | $131,400 | $62,000 | $69,400 |
| 2020 | $9,082 | $131,400 | $62,000 | $69,400 |
| 2019 | $9,052 | $131,400 | $62,000 | $69,400 |
| 2018 | $9,050 | $131,400 | $62,000 | $69,400 |
| 2017 | $9,878 | $146,600 | $67,000 | $79,600 |
| 2016 | $9,567 | $146,600 | $67,000 | $79,600 |
| 2015 | $9,202 | $146,600 | $67,000 | $79,600 |
| 2014 | $9,023 | $146,600 | $67,000 | $79,600 |
Source: Public Records
Map
Nearby Homes
- 1611 Dewitt Terrace
- 357 Edgewood Rd
- 426 Edgewood Rd
- 1720 Dewitt Terrace
- 222 Yale Terrace
- 204 Swarthmore Rd
- 614 Inwood Rd
- 1718 Summit Terrace
- 1715 Orchard Terrace
- 1000 Academy Terrace
- 123 Robbinwood Terrace
- 112 Melrose Terrace
- 1405 Kent Place
- 46 Palisade Rd
- 905 Dewitt St
- 1210 Orchard Terrace
- 906 Dewitt St
- 925 Summit St
- 15 Swarthmore Rd
- 1915 Crescent Pkwy
- 422 Princeton Rd
- 414 Princeton Rd
- 425 Fairway Rd
- 431 Fairway Rd
- 410 Princeton Rd
- 500 Princeton Rd
- 421 Princeton Rd
- 433 Fairway Rd
- 415 Princeton Rd
- 421 Fairway Rd
- 406 Princeton Rd
- 409 Princeton Rd
- 508 Princeton Rd
- 501 Fairway Rd
- 501 Princeton Rd
- 415 Fairway Rd
- 507 Exeter Rd
- 404 Princeton Rd
- 514 Princeton Rd
- 1501 Sunnyfield Dr