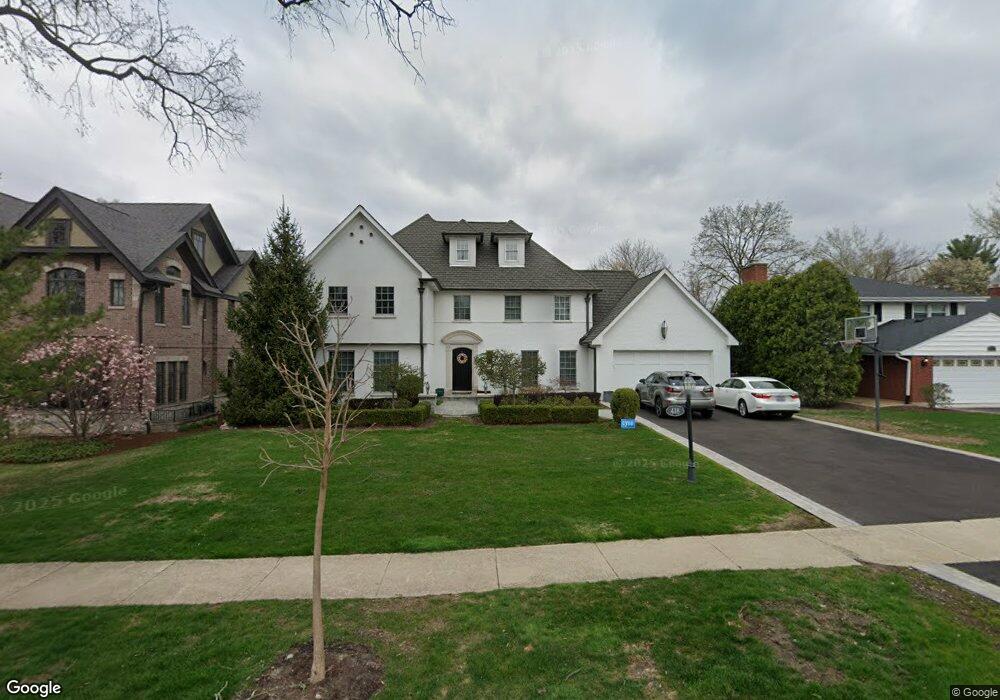
418 Ruby St Clarendon Hills, IL 60514
Estimated Value: $1,013,000 - $1,695,000
4
Beds
3
Baths
3,000
Sq Ft
$444/Sq Ft
Est. Value
About This Home
This home is located at 418 Ruby St, Clarendon Hills, IL 60514 and is currently estimated at $1,333,185, approximately $444 per square foot. 418 Ruby St is a home located in DuPage County with nearby schools including Walker Elementary School, Clarendon Hills Middle School, and Hinsdale Central High School.
Ownership History
Date
Name
Owned For
Owner Type
Purchase Details
Closed on
Dec 14, 2011
Sold by
Aurora Loan Services Llc
Bought by
Marchertas Tomas and Marchertas Vaiva
Current Estimated Value
Home Financials for this Owner
Home Financials are based on the most recent Mortgage that was taken out on this home.
Original Mortgage
$356,100
Outstanding Balance
$243,363
Interest Rate
3.99%
Mortgage Type
New Conventional
Estimated Equity
$1,089,822
Purchase Details
Closed on
Sep 23, 2011
Sold by
Anderson Jason B and Case #09 Ch 5793
Bought by
Aurora Loan Services Llc
Purchase Details
Closed on
Nov 29, 2004
Sold by
Gorski Joseph Edward and Gorski Nancy A
Bought by
Anderson Jason B
Home Financials for this Owner
Home Financials are based on the most recent Mortgage that was taken out on this home.
Original Mortgage
$596,000
Interest Rate
6%
Mortgage Type
Purchase Money Mortgage
Create a Home Valuation Report for This Property
The Home Valuation Report is an in-depth analysis detailing your home's value as well as a comparison with similar homes in the area
Home Values in the Area
Average Home Value in this Area
Purchase History
| Date | Buyer | Sale Price | Title Company |
|---|---|---|---|
| Marchertas Tomas | $501,000 | Ctic | |
| Aurora Loan Services Llc | -- | None Available | |
| Anderson Jason B | $745,000 | Premier Title |
Source: Public Records
Mortgage History
| Date | Status | Borrower | Loan Amount |
|---|---|---|---|
| Open | Marchertas Tomas | $356,100 | |
| Previous Owner | Anderson Jason B | $596,000 |
Source: Public Records
Tax History
| Year | Tax Paid | Tax Assessment Tax Assessment Total Assessment is a certain percentage of the fair market value that is determined by local assessors to be the total taxable value of land and additions on the property. | Land | Improvement |
|---|---|---|---|---|
| 2024 | $27,030 | $462,000 | $146,701 | $315,299 |
| 2023 | $25,342 | $424,710 | $134,860 | $289,850 |
| 2022 | $24,393 | $413,950 | $131,440 | $282,510 |
| 2021 | $23,622 | $409,250 | $129,950 | $279,300 |
| 2020 | $23,189 | $401,150 | $127,380 | $273,770 |
| 2019 | $23,064 | $384,900 | $122,220 | $262,680 |
| 2018 | $22,186 | $383,140 | $121,550 | $261,590 |
| 2017 | $23,026 | $396,650 | $116,960 | $279,690 |
| 2016 | $22,588 | $378,550 | $111,620 | $266,930 |
| 2015 | $21,934 | $356,140 | $105,010 | $251,130 |
| 2014 | $20,357 | $341,480 | $102,100 | $239,380 |
| 2013 | $12,649 | $201,430 | $101,620 | $99,810 |
Source: Public Records
Map
Nearby Homes
- 372 55th St
- 421 Park Ave Unit A
- 421 Park Ave Unit B
- 423 Park Ave Unit C
- 223 E 56th St
- 525 S Oak Ave
- 403 Burlington Ave
- 47 E 55th St
- 16W680 57th St
- 5725 S Wilmette Ave
- 6234 Western Ave
- 19 E 56th St
- 25 Hidden View Dr
- 511 S Cass Ave
- 5513 Barclay Ct Unit 36
- 225 Burlington Ave Unit 1
- 236 Holmes Ave
- 5701 Clarendon Hills Rd
- 212 Holmes Ave
- 306 S Grant St
Your Personal Tour Guide
Ask me questions while you tour the home.