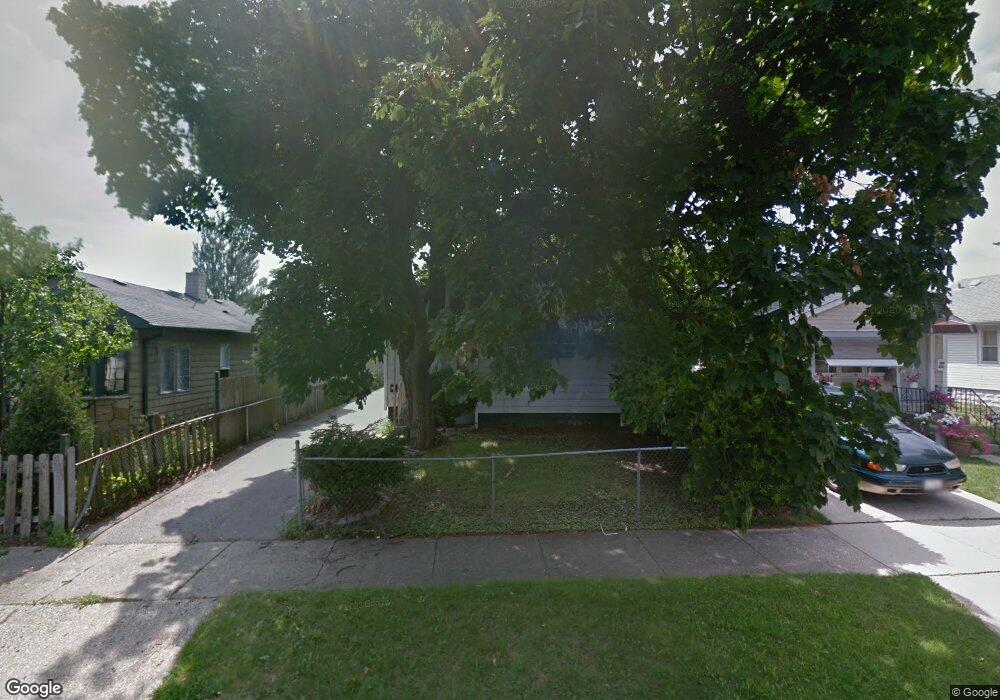
418 S Fulton Ave Waukegan, IL 60085
West Waukegan NeighborhoodEstimated Value: $149,000 - $197,000
3
Beds
1
Bath
1,080
Sq Ft
$165/Sq Ft
Est. Value
About This Home
This home is located at 418 S Fulton Ave, Waukegan, IL 60085 and is currently estimated at $178,667, approximately $165 per square foot. 418 S Fulton Ave is a home located in Lake County with nearby schools including Washington Elementary School, Robert E. Abbott Middle School, and Waukegan High School.
Ownership History
Date
Name
Owned For
Owner Type
Purchase Details
Closed on
Oct 19, 2000
Sold by
Nationscredit Home Equity Services Corp
Bought by
Kruse Keith
Current Estimated Value
Home Financials for this Owner
Home Financials are based on the most recent Mortgage that was taken out on this home.
Original Mortgage
$50,300
Interest Rate
7.87%
Purchase Details
Closed on
Jul 27, 2000
Sold by
Garcia
Bought by
Nationscredit Home Equity Services Corp
Purchase Details
Closed on
Jan 14, 1998
Sold by
Garcia Mercedez and Garcia Nancy K
Bought by
Garcia Mercedez and Sanchez Adrian
Home Financials for this Owner
Home Financials are based on the most recent Mortgage that was taken out on this home.
Original Mortgage
$90,000
Interest Rate
9.49%
Purchase Details
Closed on
Aug 15, 1996
Sold by
Soto Jose D and Soto Josefa
Bought by
Garcia Mercedez and Garcia Nancy K
Home Financials for this Owner
Home Financials are based on the most recent Mortgage that was taken out on this home.
Original Mortgage
$80,010
Interest Rate
8.18%
Mortgage Type
FHA
Create a Home Valuation Report for This Property
The Home Valuation Report is an in-depth analysis detailing your home's value as well as a comparison with similar homes in the area
Home Values in the Area
Average Home Value in this Area
Purchase History
| Date | Buyer | Sale Price | Title Company |
|---|---|---|---|
| Kruse Keith | $63,000 | Stewart Title Company | |
| Nationscredit Home Equity Services Corp | -- | -- | |
| Garcia Mercedez | -- | -- | |
| Garcia Mercedez | $80,000 | -- |
Source: Public Records
Mortgage History
| Date | Status | Borrower | Loan Amount |
|---|---|---|---|
| Previous Owner | Kruse Keith | $50,300 | |
| Previous Owner | Garcia Mercedez | $90,000 | |
| Previous Owner | Garcia Mercedez | $80,010 |
Source: Public Records
Tax History Compared to Growth
Tax History
| Year | Tax Paid | Tax Assessment Tax Assessment Total Assessment is a certain percentage of the fair market value that is determined by local assessors to be the total taxable value of land and additions on the property. | Land | Improvement |
|---|---|---|---|---|
| 2024 | $3,853 | $45,684 | $6,619 | $39,065 |
| 2023 | $3,496 | $40,866 | $5,921 | $34,945 |
| 2022 | $3,496 | $35,759 | $5,257 | $30,502 |
| 2021 | $3,118 | $29,903 | $4,521 | $25,382 |
| 2020 | $3,158 | $27,858 | $4,212 | $23,646 |
| 2019 | $3,178 | $25,528 | $3,860 | $21,668 |
| 2018 | $2,652 | $20,515 | $5,463 | $15,052 |
| 2017 | $2,582 | $18,150 | $4,833 | $13,317 |
| 2016 | $2,437 | $15,772 | $4,200 | $11,572 |
| 2015 | $2,385 | $14,116 | $3,759 | $10,357 |
| 2014 | $2,820 | $16,669 | $3,787 | $12,882 |
| 2012 | $3,106 | $18,061 | $4,104 | $13,957 |
Source: Public Records
Map
Nearby Homes
- 1521 Catalpa Ave
- 49 S Lewis Ave
- 446 S Jackson St
- 12601 W Atlantic Ave
- 2116 & 2101 Williamsburg Dr
- 1416 Hamilton Ct
- 132 Dorchester Ct
- 304 Powell Ave
- 819 S Fulton Ave
- 408 Besley Place
- 305 Besley Place
- 23 N Jackson St
- 910 Cummings Ave
- 613 Clarke Ave
- 610 Bluff St
- 600 Sunderlin St
- 215 S Park Ave
- 2726 W Hidden Glen Dr
- 522 George Ave
- 613 Washington St
- 416 S Fulton Ave
- 420 S Fulton Ave
- 412 S Fulton Ave
- 1712 Salem Ave
- 410 S Fulton Ave
- 428 S Fulton Ave
- 1716 Salem Ave
- 406 S Fulton Ave
- 430 S Fulton Ave
- 1713 Lloyd Ave
- 1722 Salem Ave
- 419 S Fulton Ave
- 421 S Fulton Ave
- 415 S Fulton Ave
- 400 S Fulton Ave
- 1717 Lloyd Ave
- 1713 Salem Ave
- 423 S Fulton Ave
- 432 S Fulton Ave
- 1724 Salem Ave