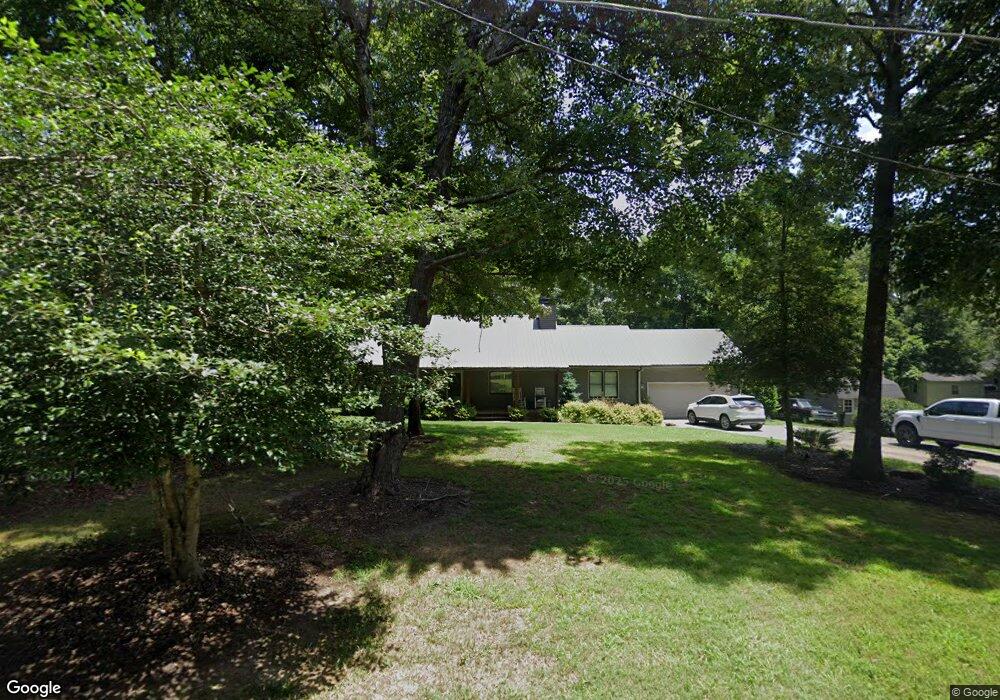
418 Sally Cir Ellijay, GA 30536
Estimated Value: $420,299 - $485,000
3
Beds
2
Baths
1,540
Sq Ft
$289/Sq Ft
Est. Value
About This Home
This home is located at 418 Sally Cir, Ellijay, GA 30536 and is currently estimated at $445,325, approximately $289 per square foot. 418 Sally Cir is a home located in Gilmer County with nearby schools including Ellijay Elementary School, Clear Creek Elementary School, and Clear Creek Middle School.
Ownership History
Date
Name
Owned For
Owner Type
Purchase Details
Closed on
Dec 30, 2019
Sold by
Rosenak Jack Tyler
Bought by
Rosenak Jack Tyler and Rosenak Molly Southern
Current Estimated Value
Home Financials for this Owner
Home Financials are based on the most recent Mortgage that was taken out on this home.
Original Mortgage
$145,600
Outstanding Balance
$112,807
Interest Rate
3.6%
Mortgage Type
New Conventional
Estimated Equity
$332,518
Purchase Details
Closed on
Oct 16, 2017
Sold by
Stiltner Hansel A
Bought by
Rosenak Jack Tyler
Home Financials for this Owner
Home Financials are based on the most recent Mortgage that was taken out on this home.
Original Mortgage
$157,000
Interest Rate
3.78%
Mortgage Type
New Conventional
Purchase Details
Closed on
Jul 6, 1998
Sold by
Stiltner Hansel
Bought by
Stiltner Hansel A A
Purchase Details
Closed on
Jan 1, 1998
Sold by
Whitaker Ben A
Bought by
Stiltner Hansel A A
Create a Home Valuation Report for This Property
The Home Valuation Report is an in-depth analysis detailing your home's value as well as a comparison with similar homes in the area
Home Values in the Area
Average Home Value in this Area
Purchase History
| Date | Buyer | Sale Price | Title Company |
|---|---|---|---|
| Rosenak Jack Tyler | -- | -- | |
| Rosenak Jack Tyler | $157,000 | -- | |
| Stiltner Hansel A A | -- | -- | |
| Stiltner Hansel A A | $104,000 | -- | |
| Whitaker Benjamin A | -- | -- |
Source: Public Records
Mortgage History
| Date | Status | Borrower | Loan Amount |
|---|---|---|---|
| Open | Rosenak Jack Tyler | $145,600 | |
| Previous Owner | Rosenak Jack Tyler | $157,000 |
Source: Public Records
Tax History Compared to Growth
Tax History
| Year | Tax Paid | Tax Assessment Tax Assessment Total Assessment is a certain percentage of the fair market value that is determined by local assessors to be the total taxable value of land and additions on the property. | Land | Improvement |
|---|---|---|---|---|
| 2025 | $1,801 | $152,520 | $23,440 | $129,080 |
| 2024 | $1,801 | $147,200 | $19,560 | $127,640 |
| 2023 | $1,861 | $147,200 | $19,560 | $127,640 |
| 2022 | $1,767 | $119,000 | $22,080 | $96,920 |
| 2021 | $1,769 | $100,880 | $22,080 | $78,800 |
| 2020 | $1,679 | $80,720 | $15,320 | $65,400 |
| 2019 | $1,593 | $72,200 | $6,800 | $65,400 |
| 2018 | $1,696 | $73,920 | $8,520 | $65,400 |
| 2017 | $444 | $57,640 | $8,520 | $49,120 |
| 2016 | $444 | $56,880 | $7,200 | $49,680 |
| 2015 | $418 | $57,360 | $7,200 | $50,160 |
| 2014 | $369 | $48,880 | $7,200 | $41,680 |
| 2013 | -- | $49,440 | $7,200 | $42,240 |
Source: Public Records
Map
Nearby Homes
- 220 Oak Ridge Ln
- LOT 6 Riverfront Dr
- LOT 3 Riverfront Dr
- LOT 4 Riverfront Dr
- LOT 5 Riverfront Dr
- 0 Aspen Ave Unit 10501189
- 0 Aspen Ave Unit 1025047
- LOT 17 Misty Mountain Trail
- 0 Yukon Rd Unit 10649657
- LOT 3 Ridgehaven Trail
- Lots 1-3 Ridgehaven Trail
- 0 Holly Berry Ct
- 269 Old Orchard Rd
- 71 Black Walnut Place
- 0 Highway 52 W Unit 10598315
- 0 Highway 52 W Unit 7642027
- 00 Yukon Rd